Individual Project

Outline
Visualizing Vitality : Using Art to Honor Women's Health Data
Pavitr
July 2022
The artwork, “Pavitr”, is a representation of two distinct facets of a woman's life, specifically highlighting data related to underweight and overweight women as measured by Body Mass Index (BMI), as well as the prevalence of anemia in pregnant and non-pregnant women in India, as reported in the NFHS-5 study.
data
Observing ongoing efforts to raise awareness about various women's issues, I noticed campaigns addressing gender equality, women's health, violence, empowerment, and rights, including breast cancer, reproductive health, and mental health. However, analyzing NFHS-5 data revealed overlooked concerns like anaemia and BMI across states and union territories, prompting a vital conversation on women's health.

After surfing for very long time, I selected two variables to work upon for my Data work.
Anemia in Pregnant and non-pregnant women
bmi of women
Next question which arose was…
Data Viz?
or Data Art?
So I started sketching
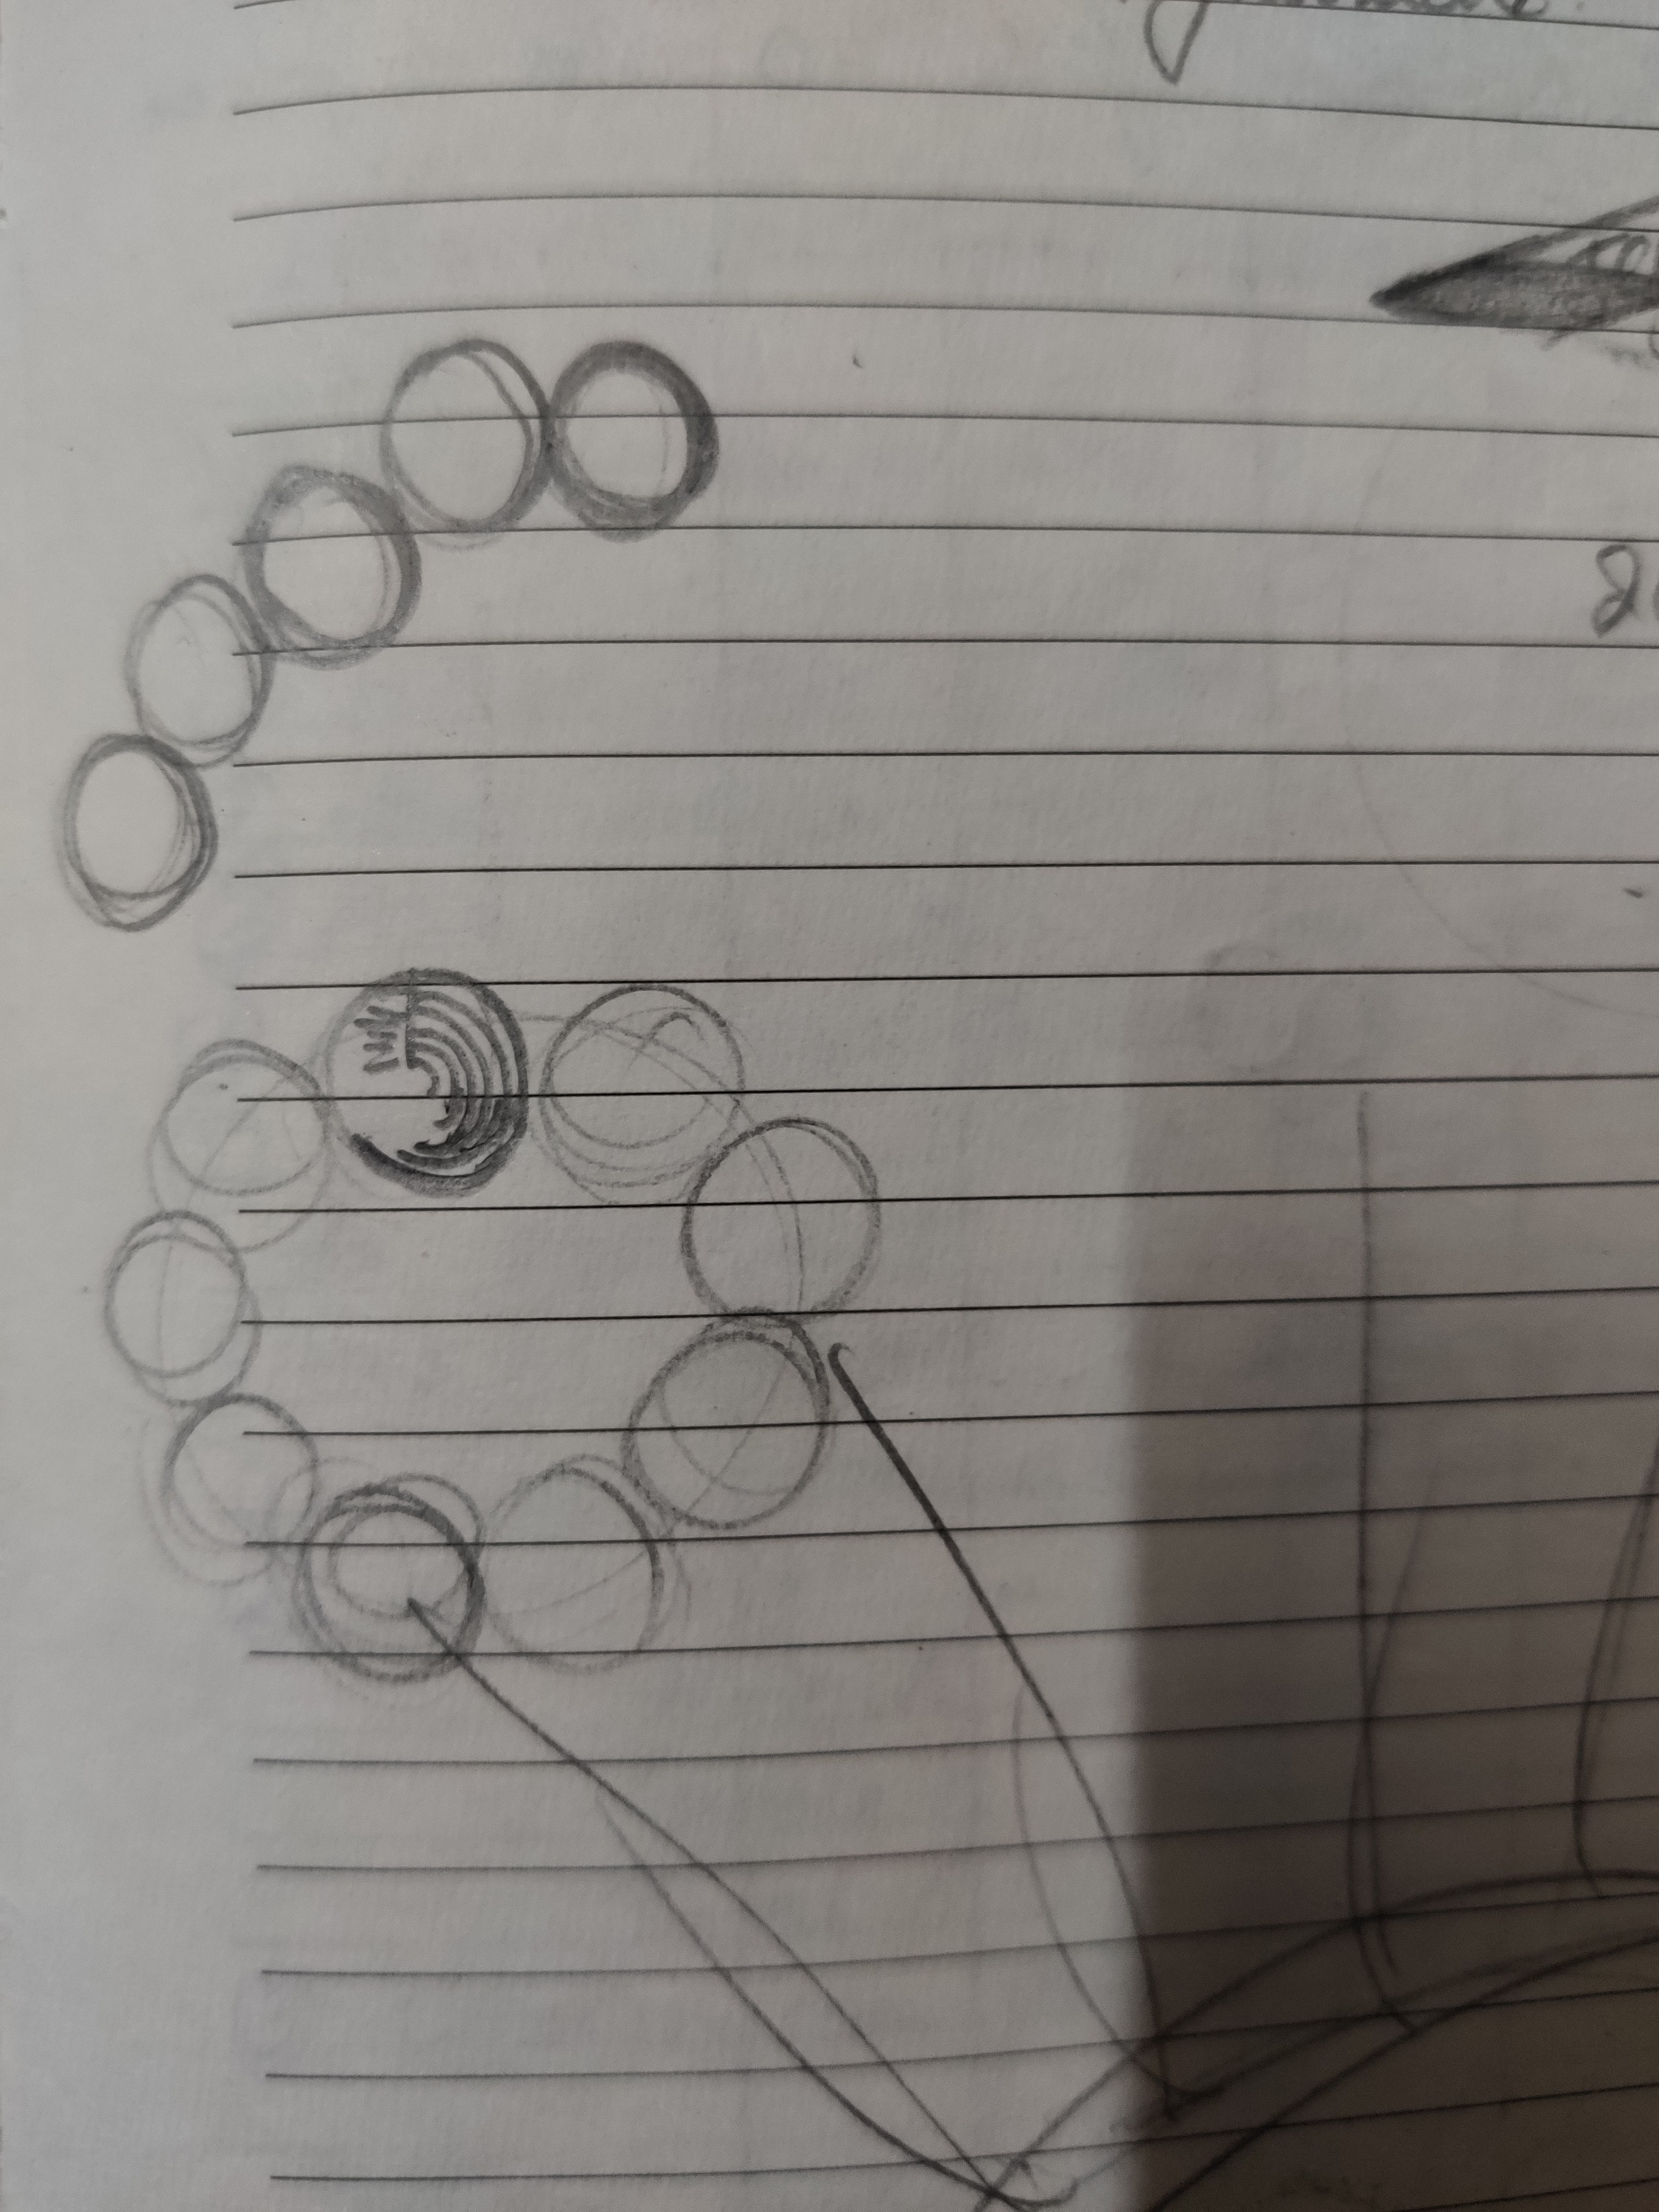
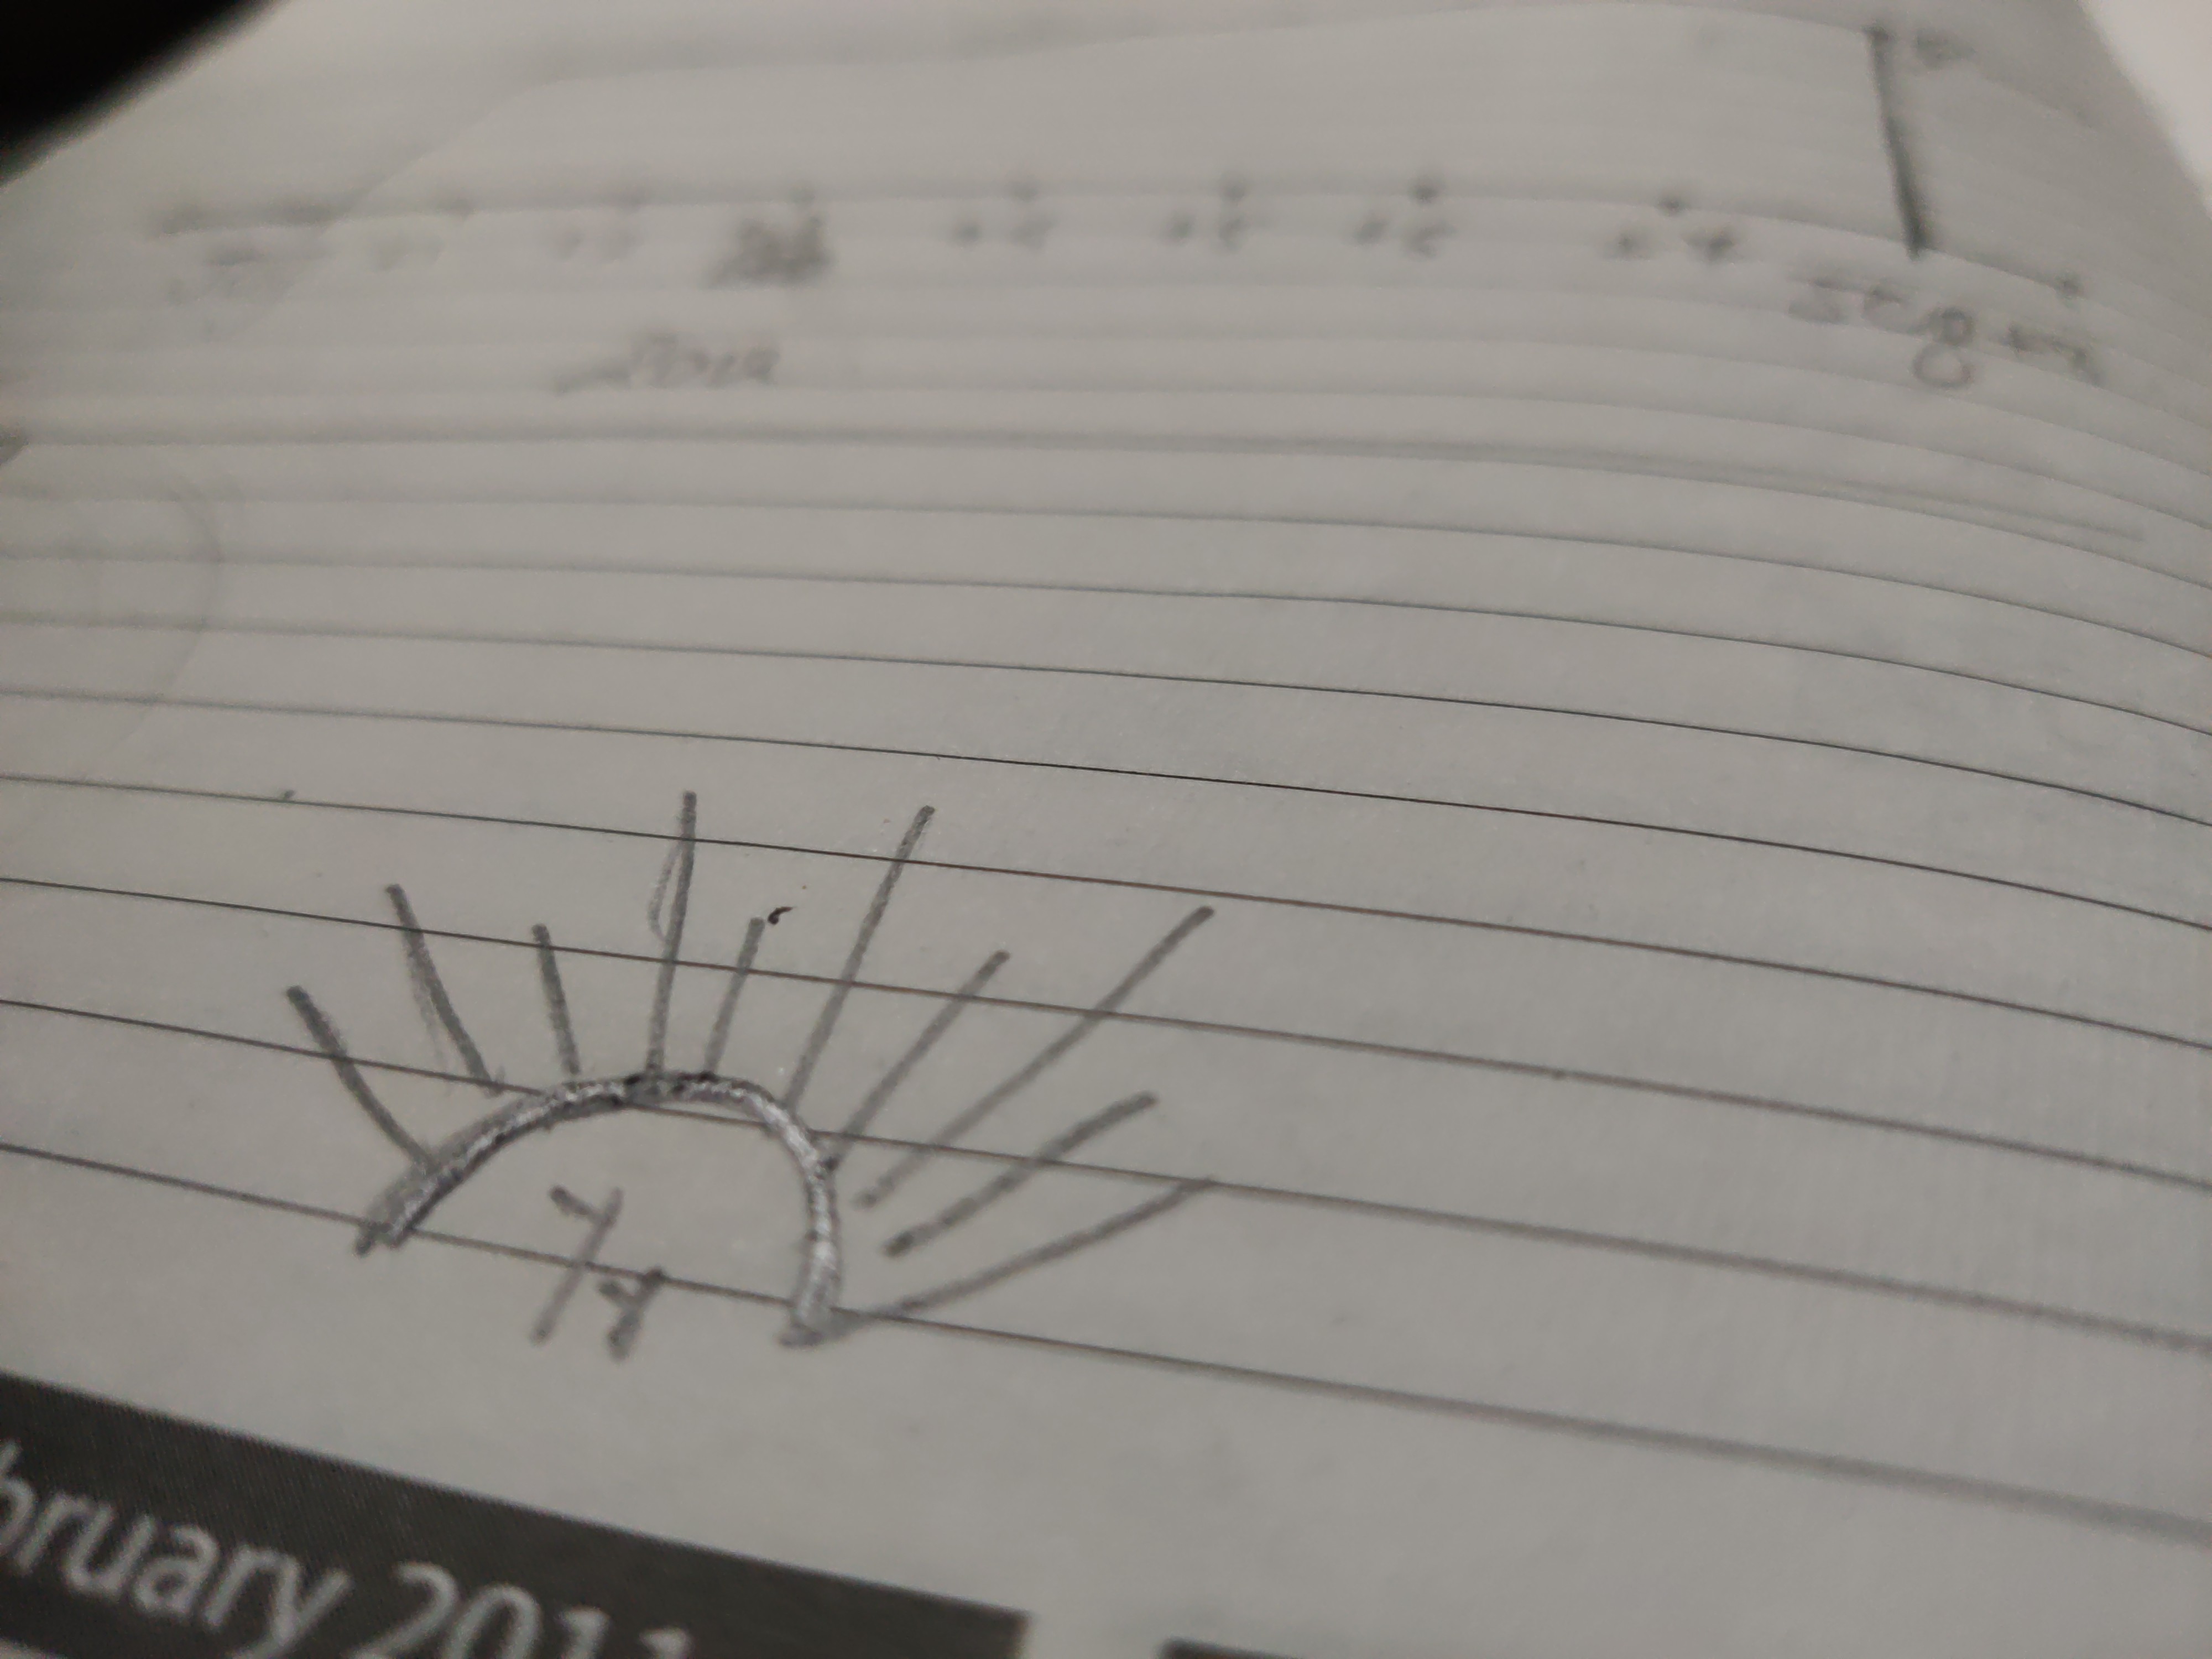
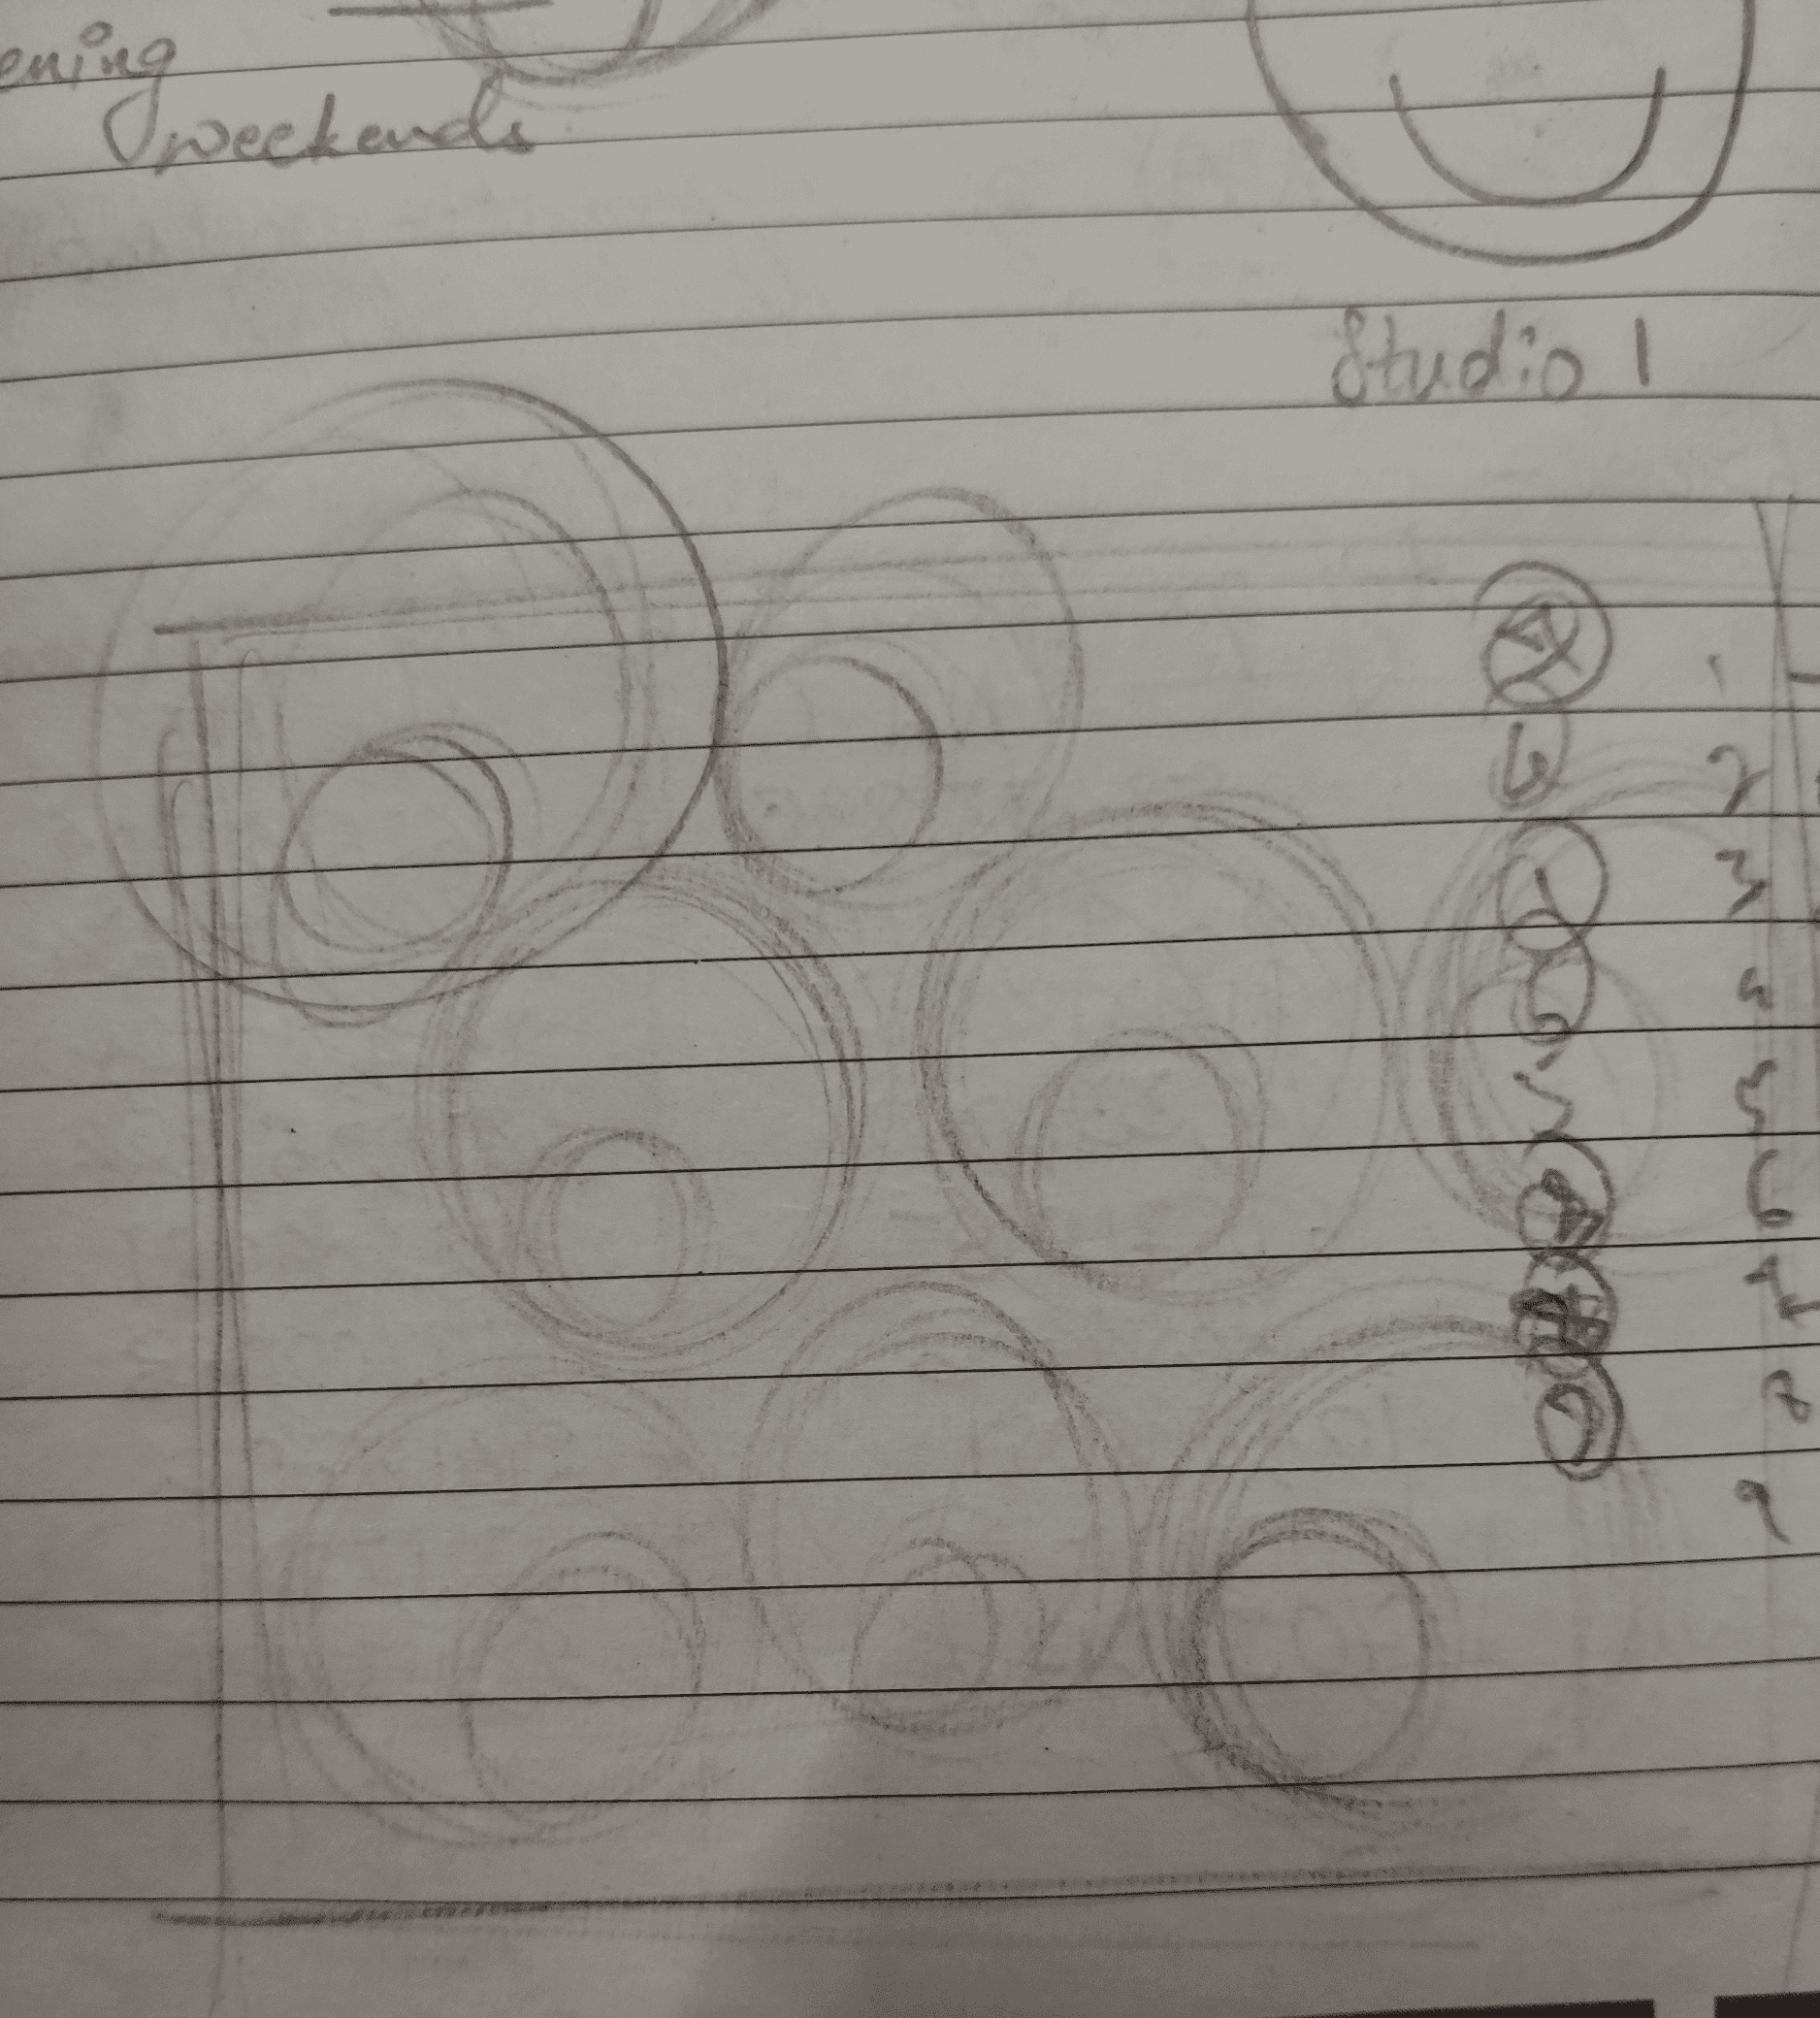
Well, it all started with scratching my head and doodling around.
Data viz or data art?
i just kept on ideating and doodling with a lot of p&Cs.
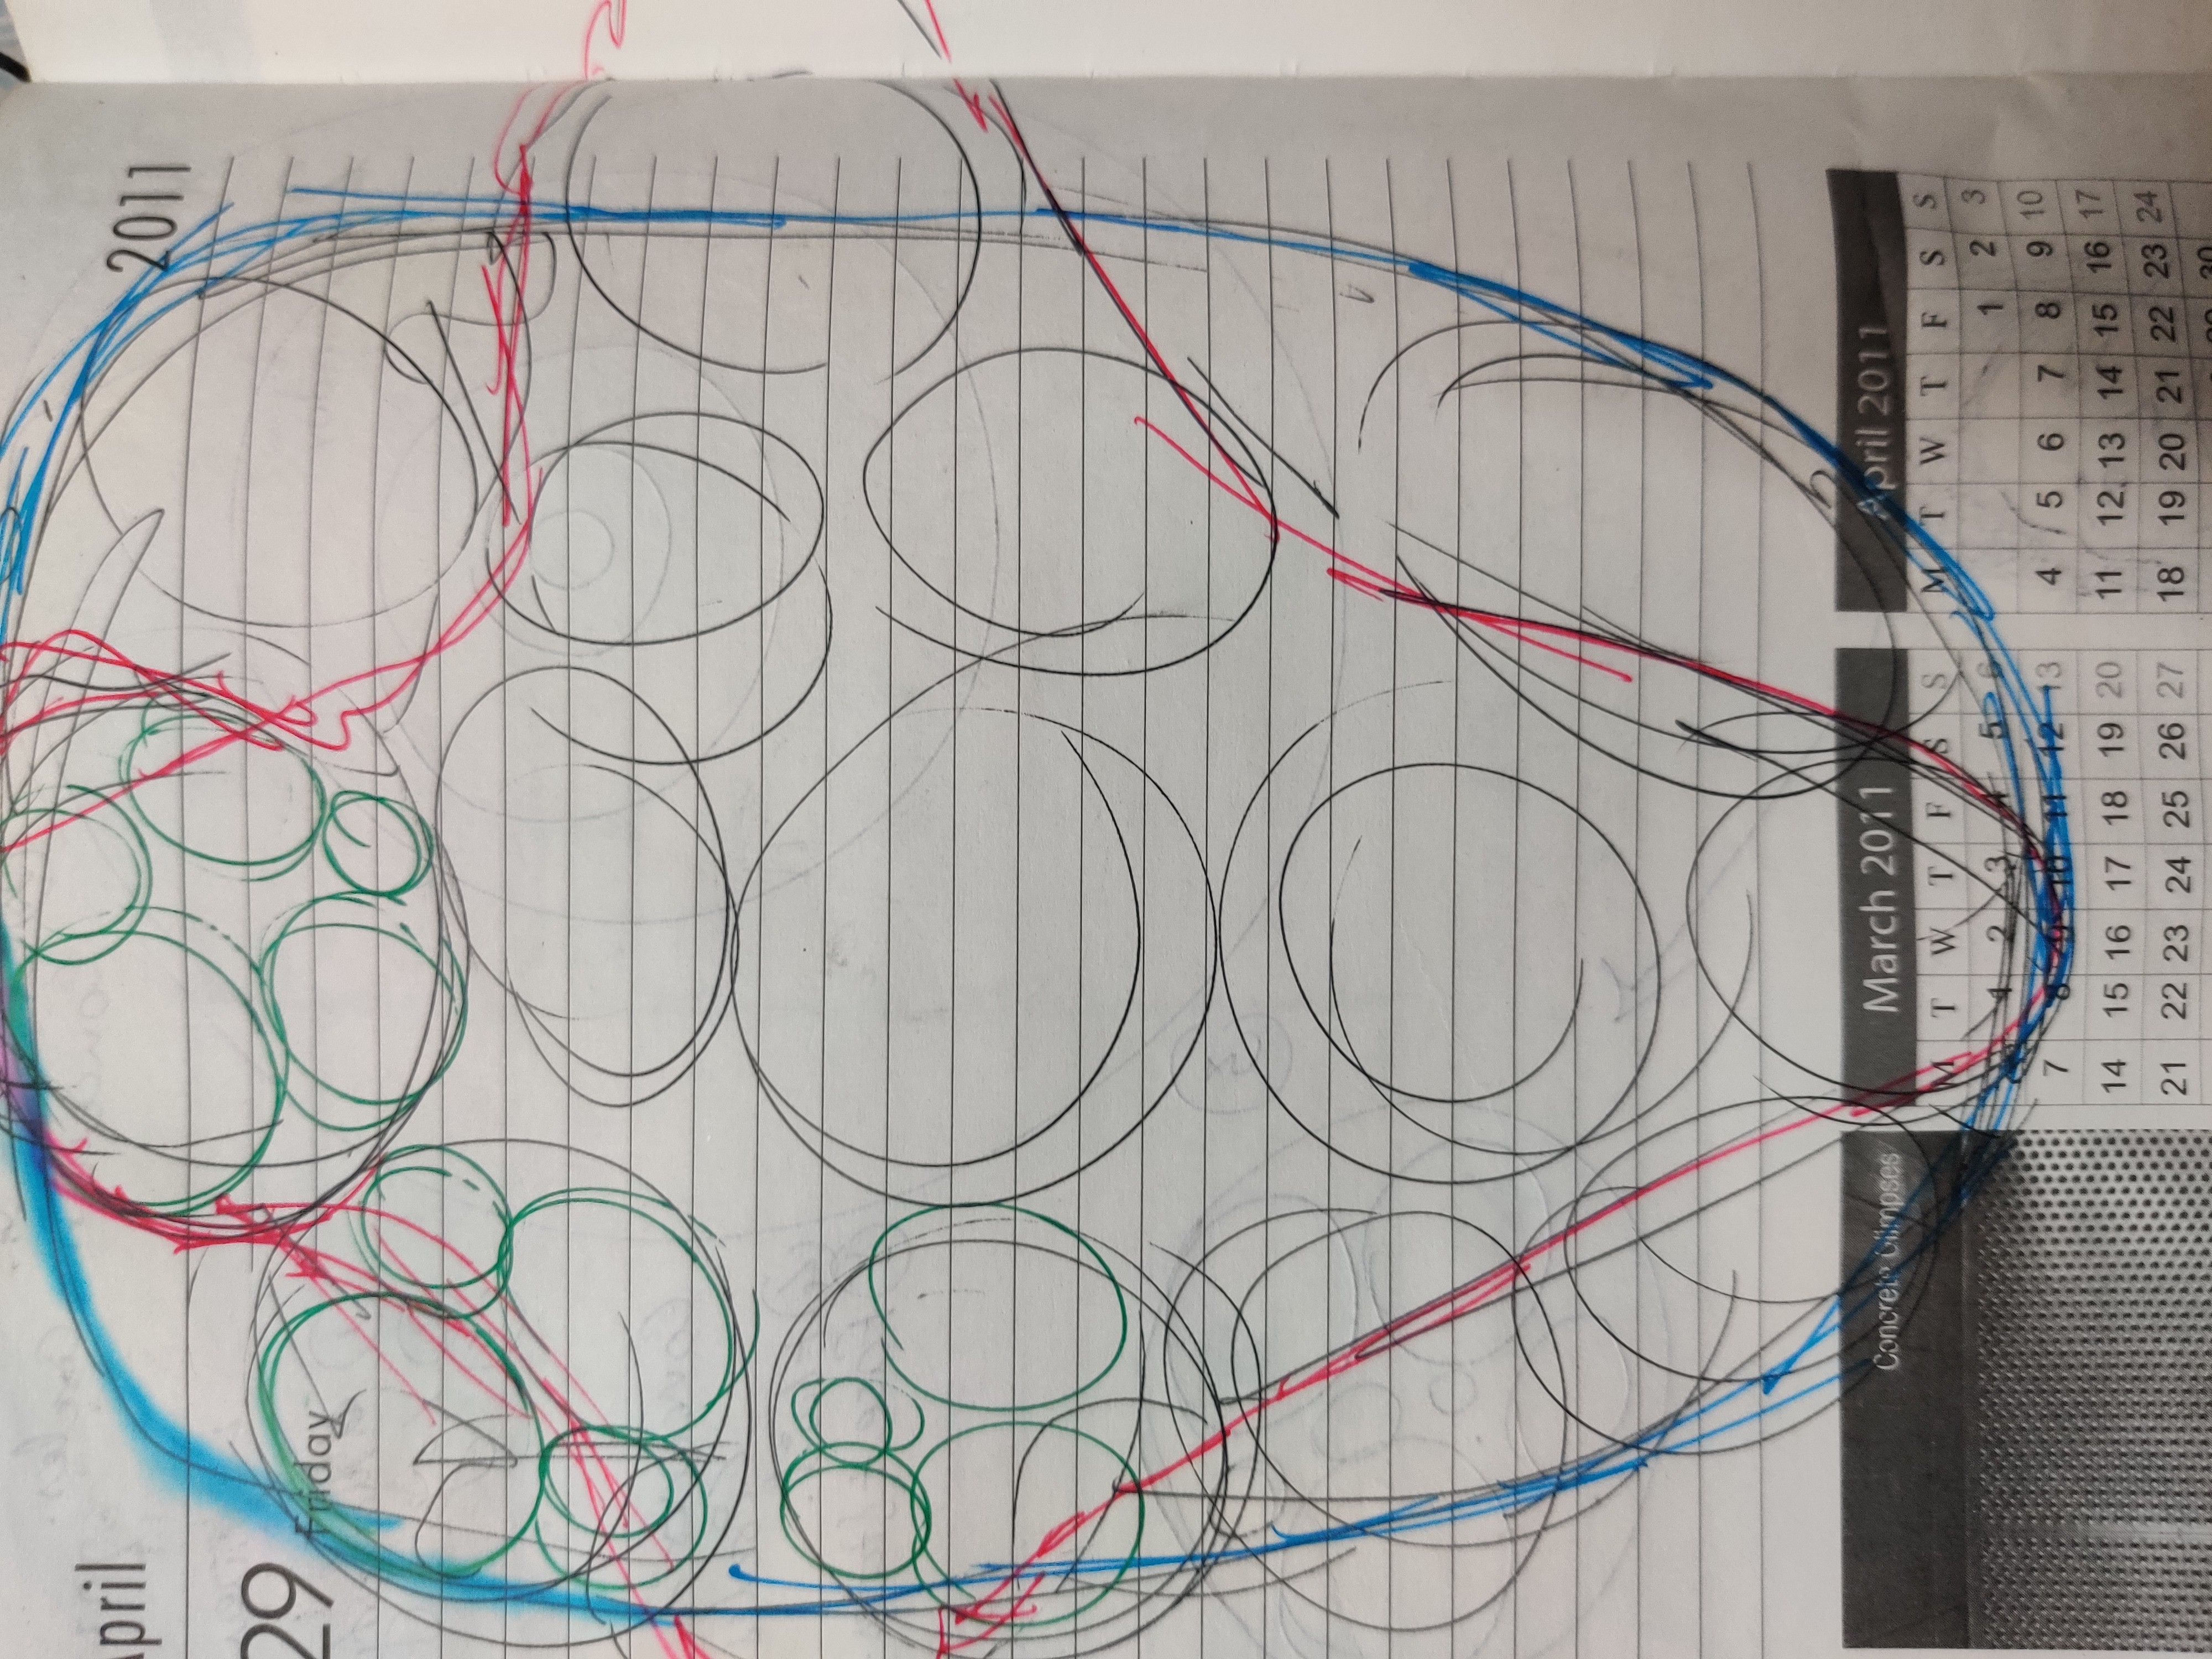
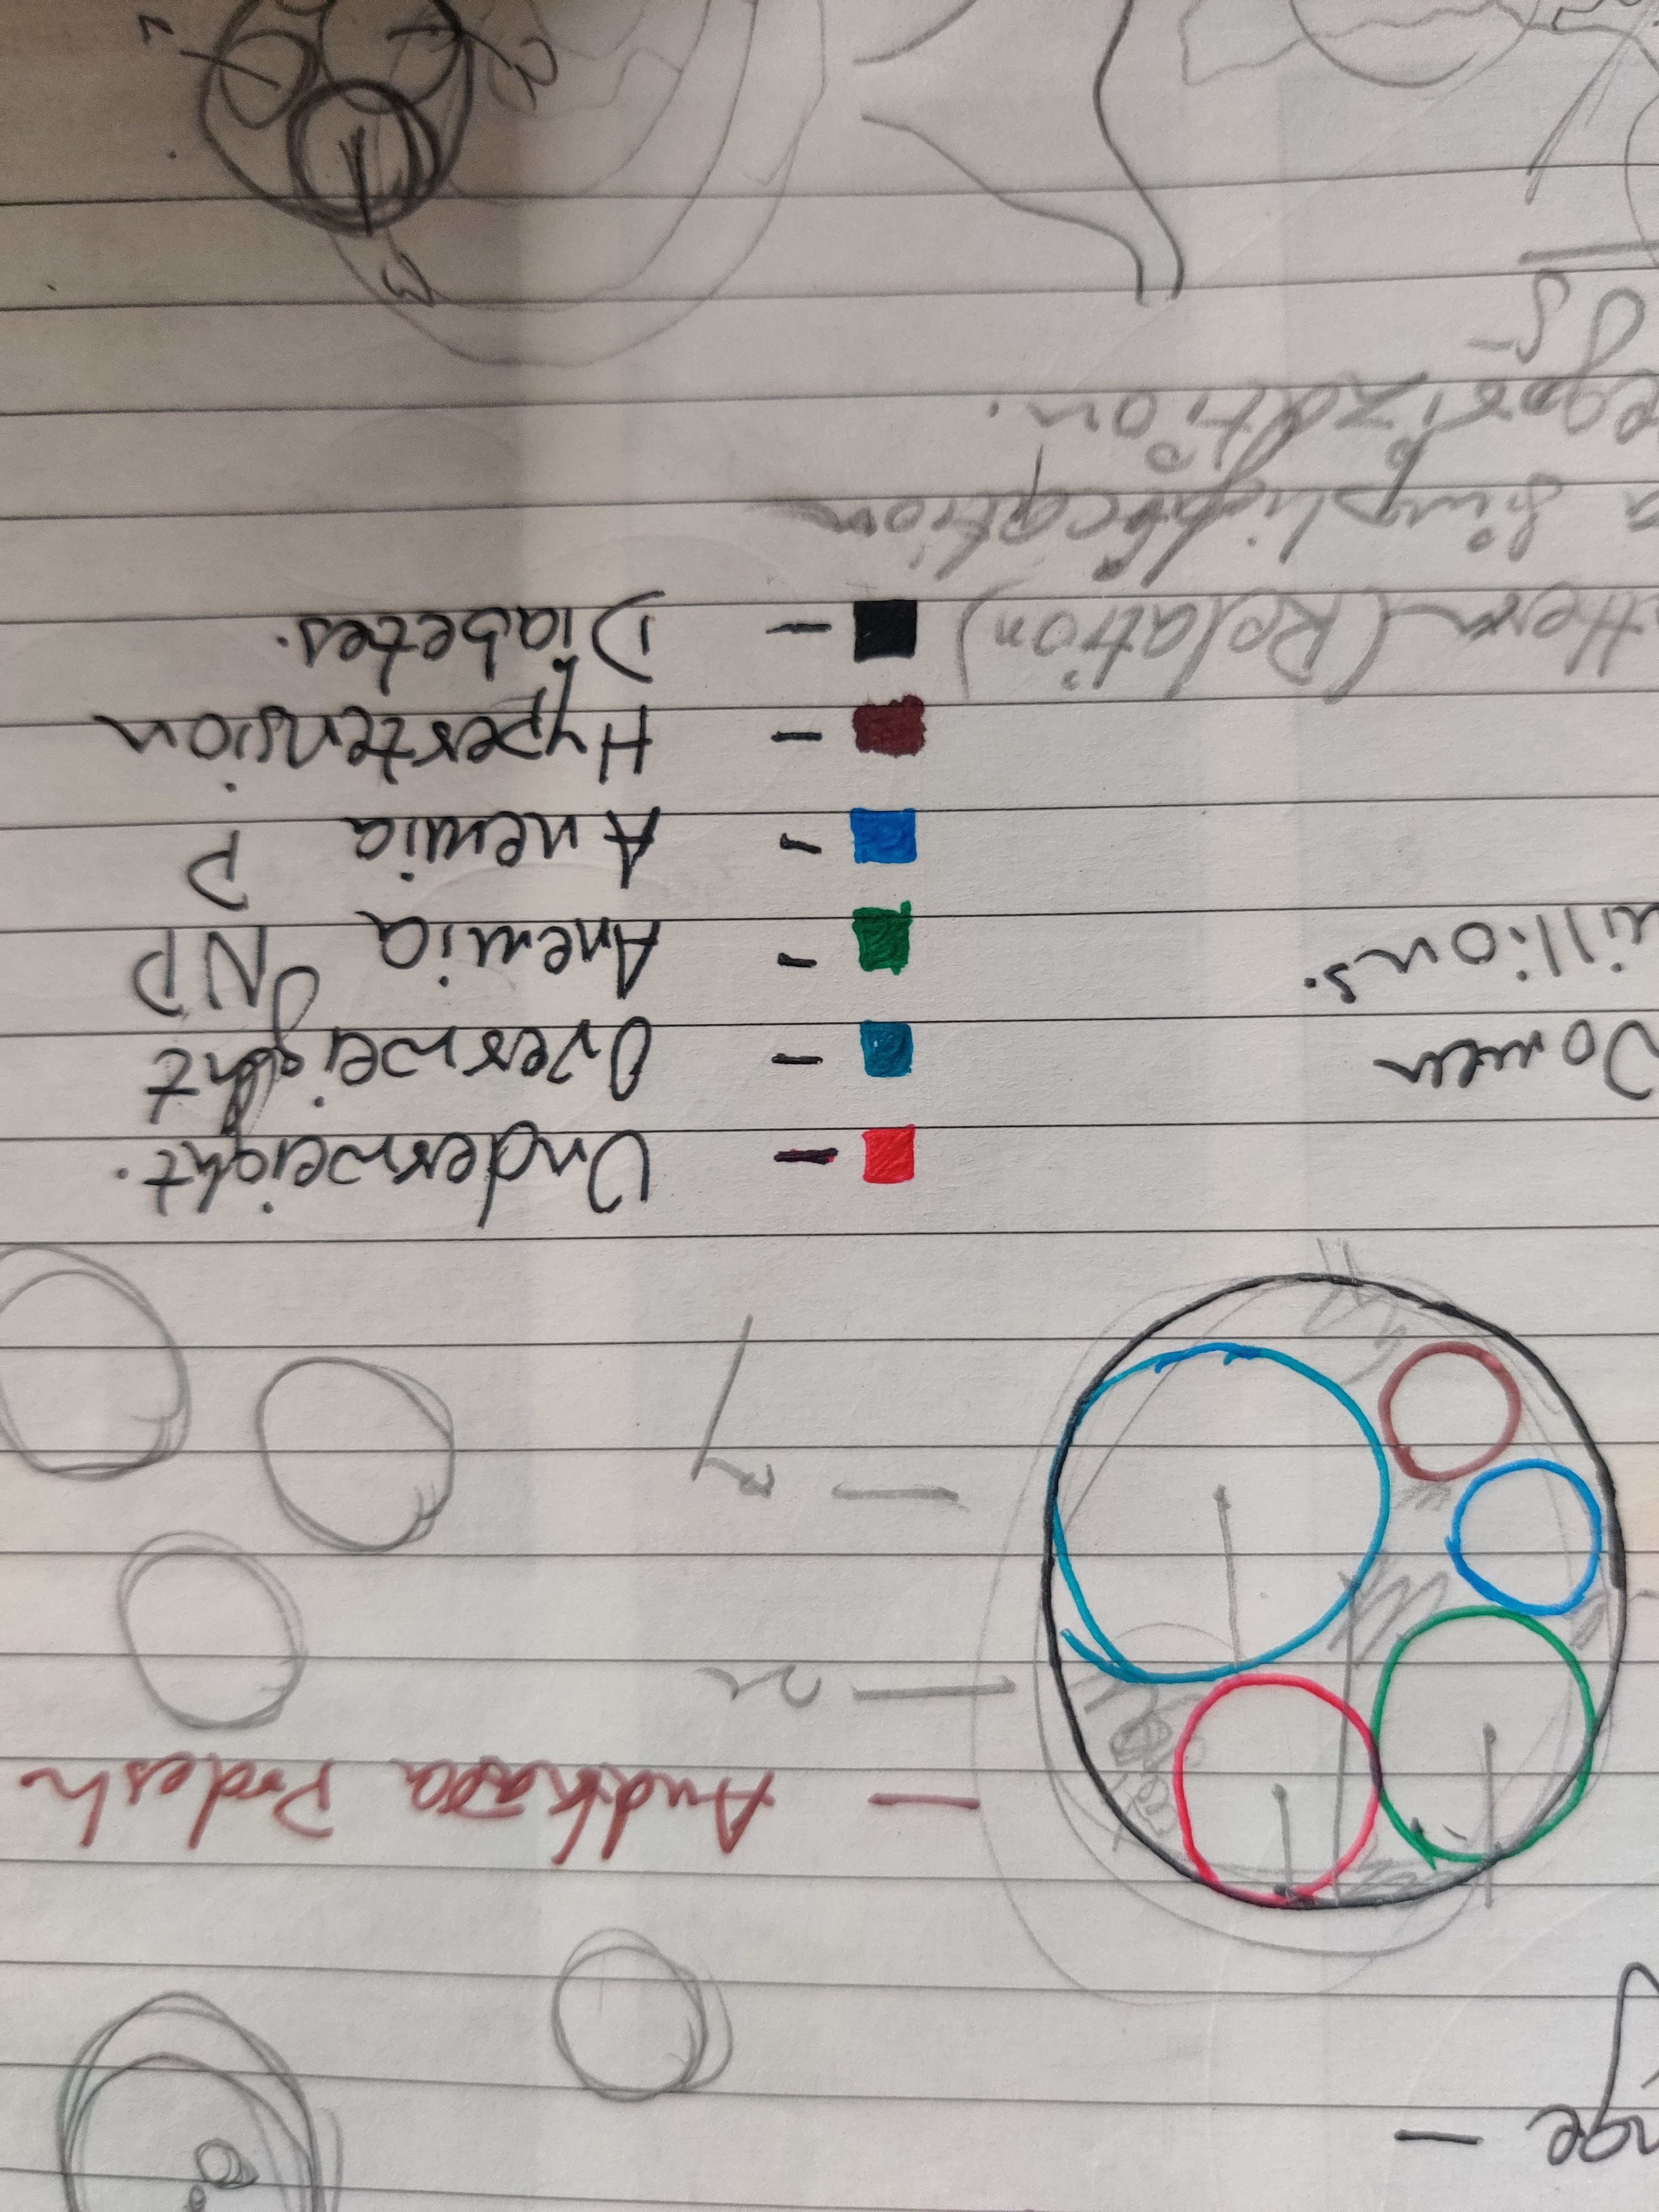
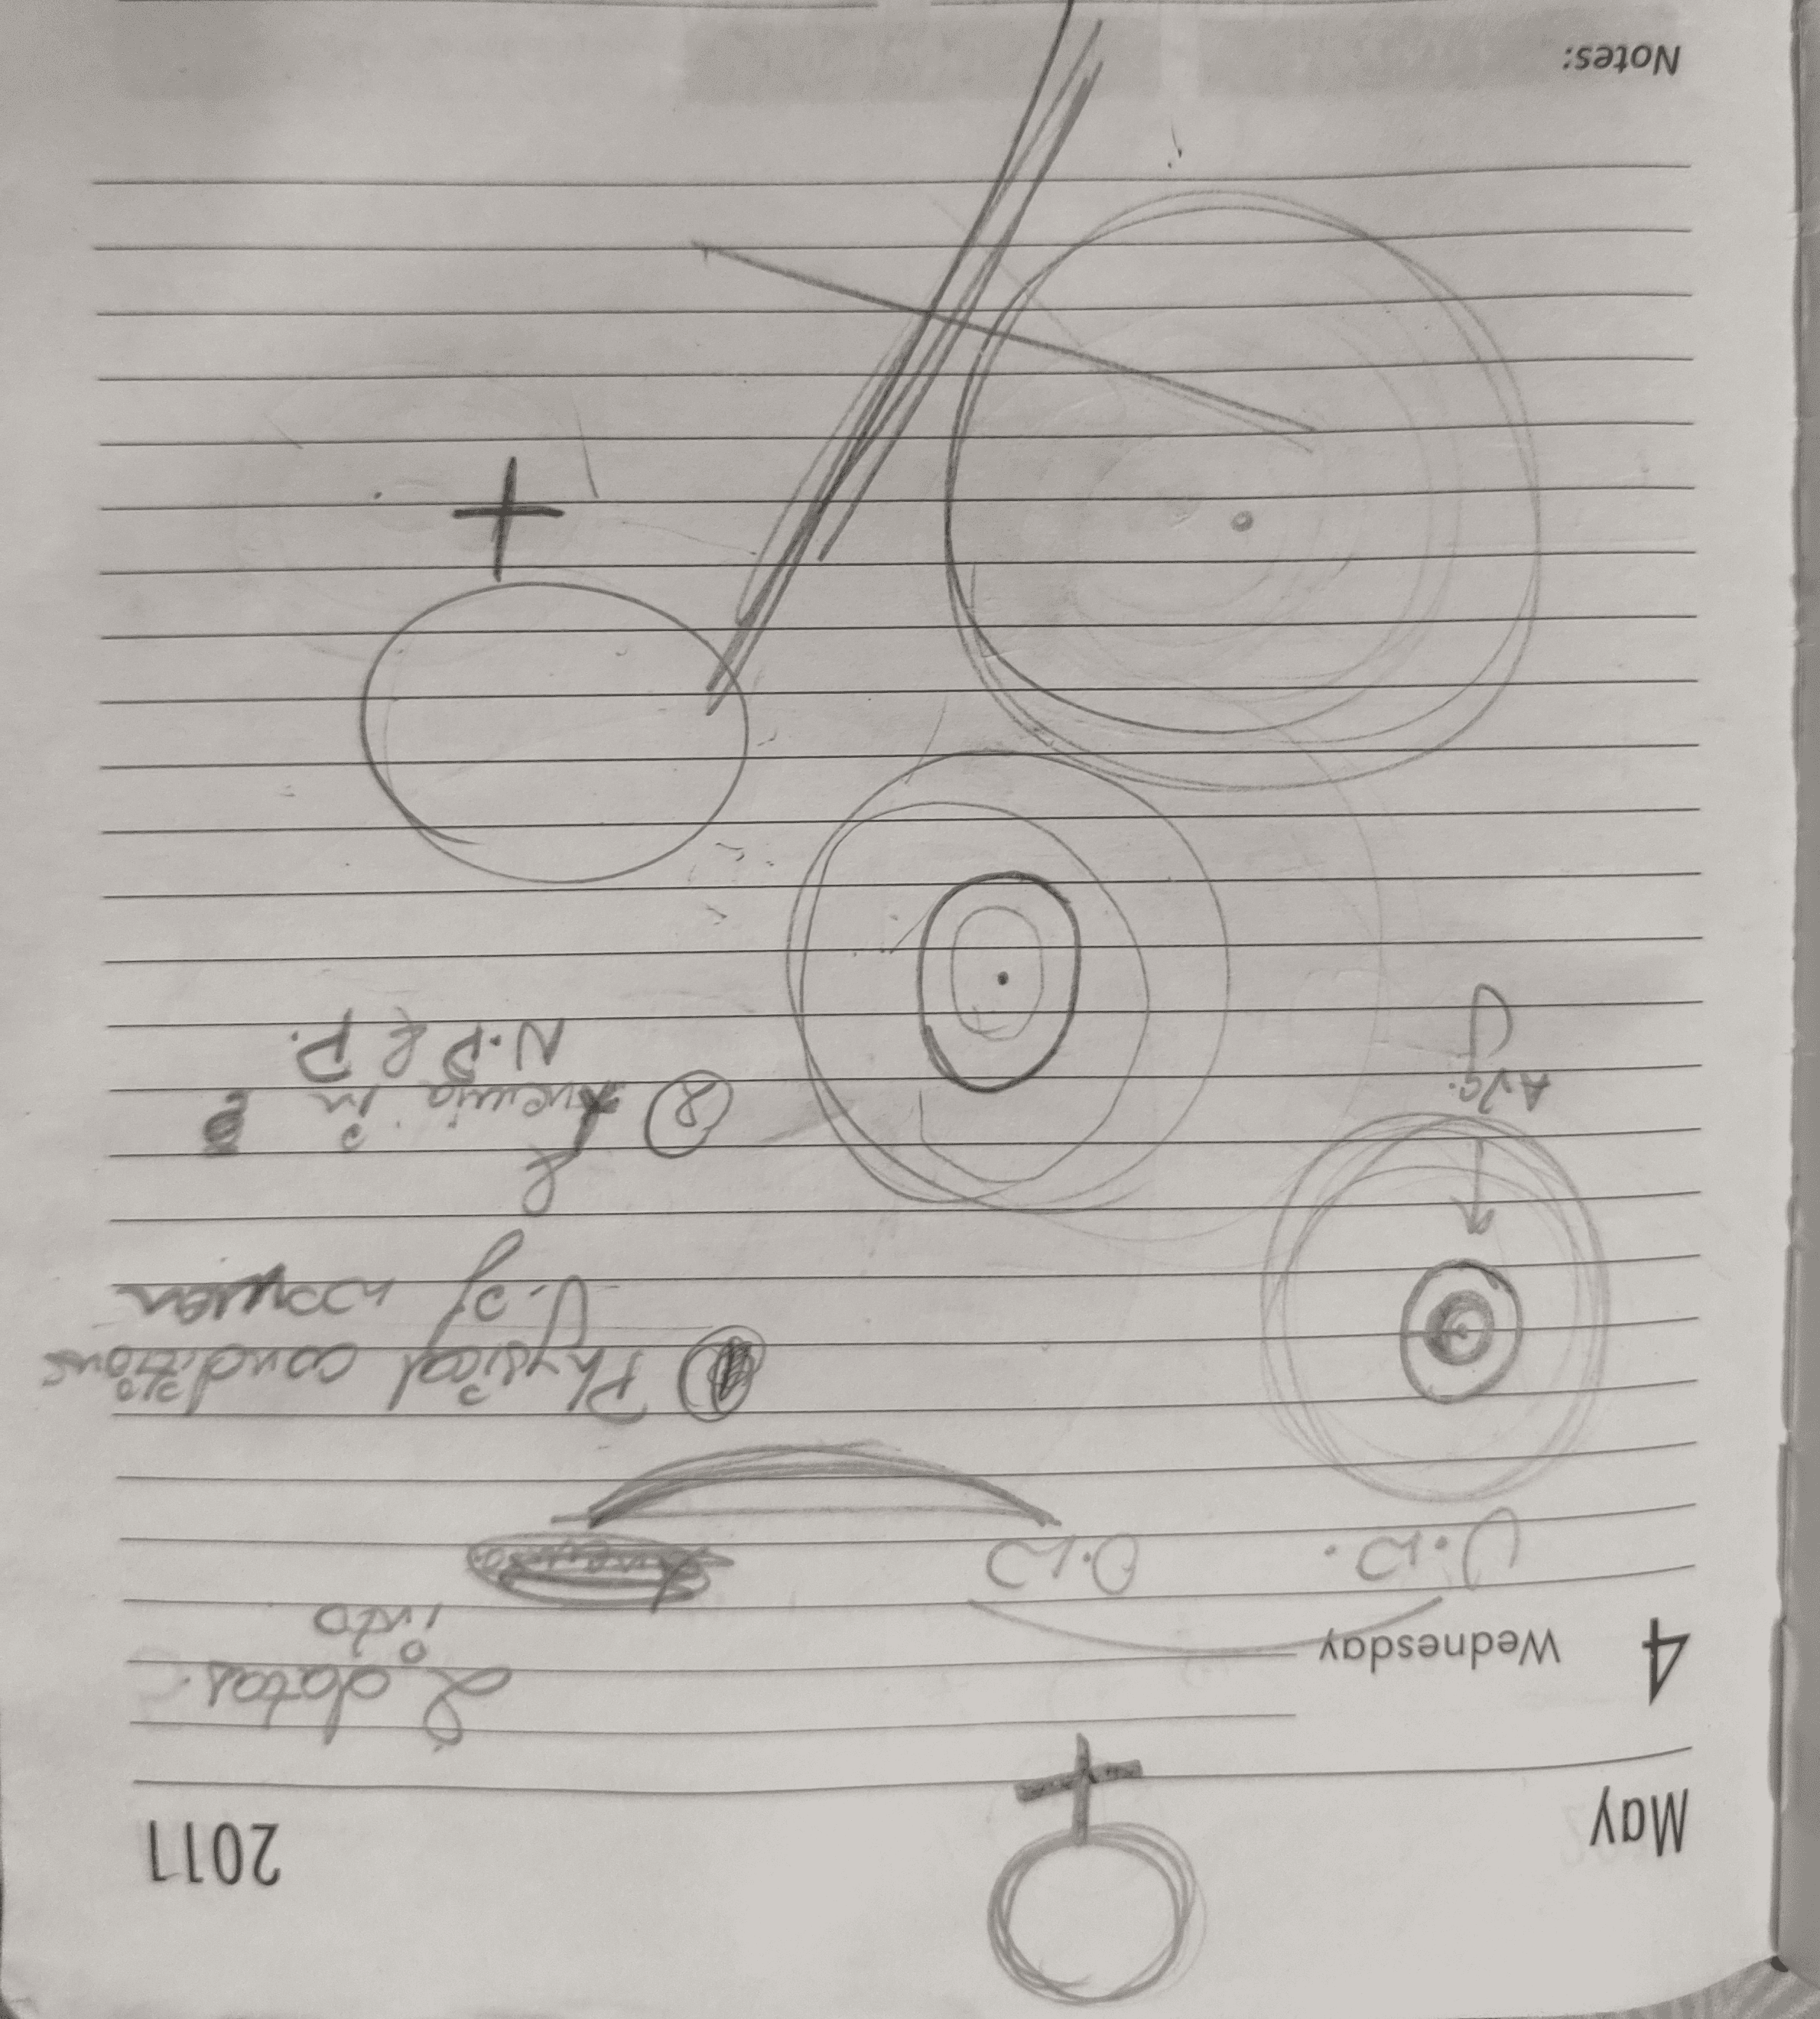
Putting different encodes to topics and exploring with 2-3 layers of content
Did a lot of experiments across the periodic table (Hypothetical)
Even tried to use the symbol used to represent females.
But couldn’t visualize further
Was about to add two topics extra as well
#josh
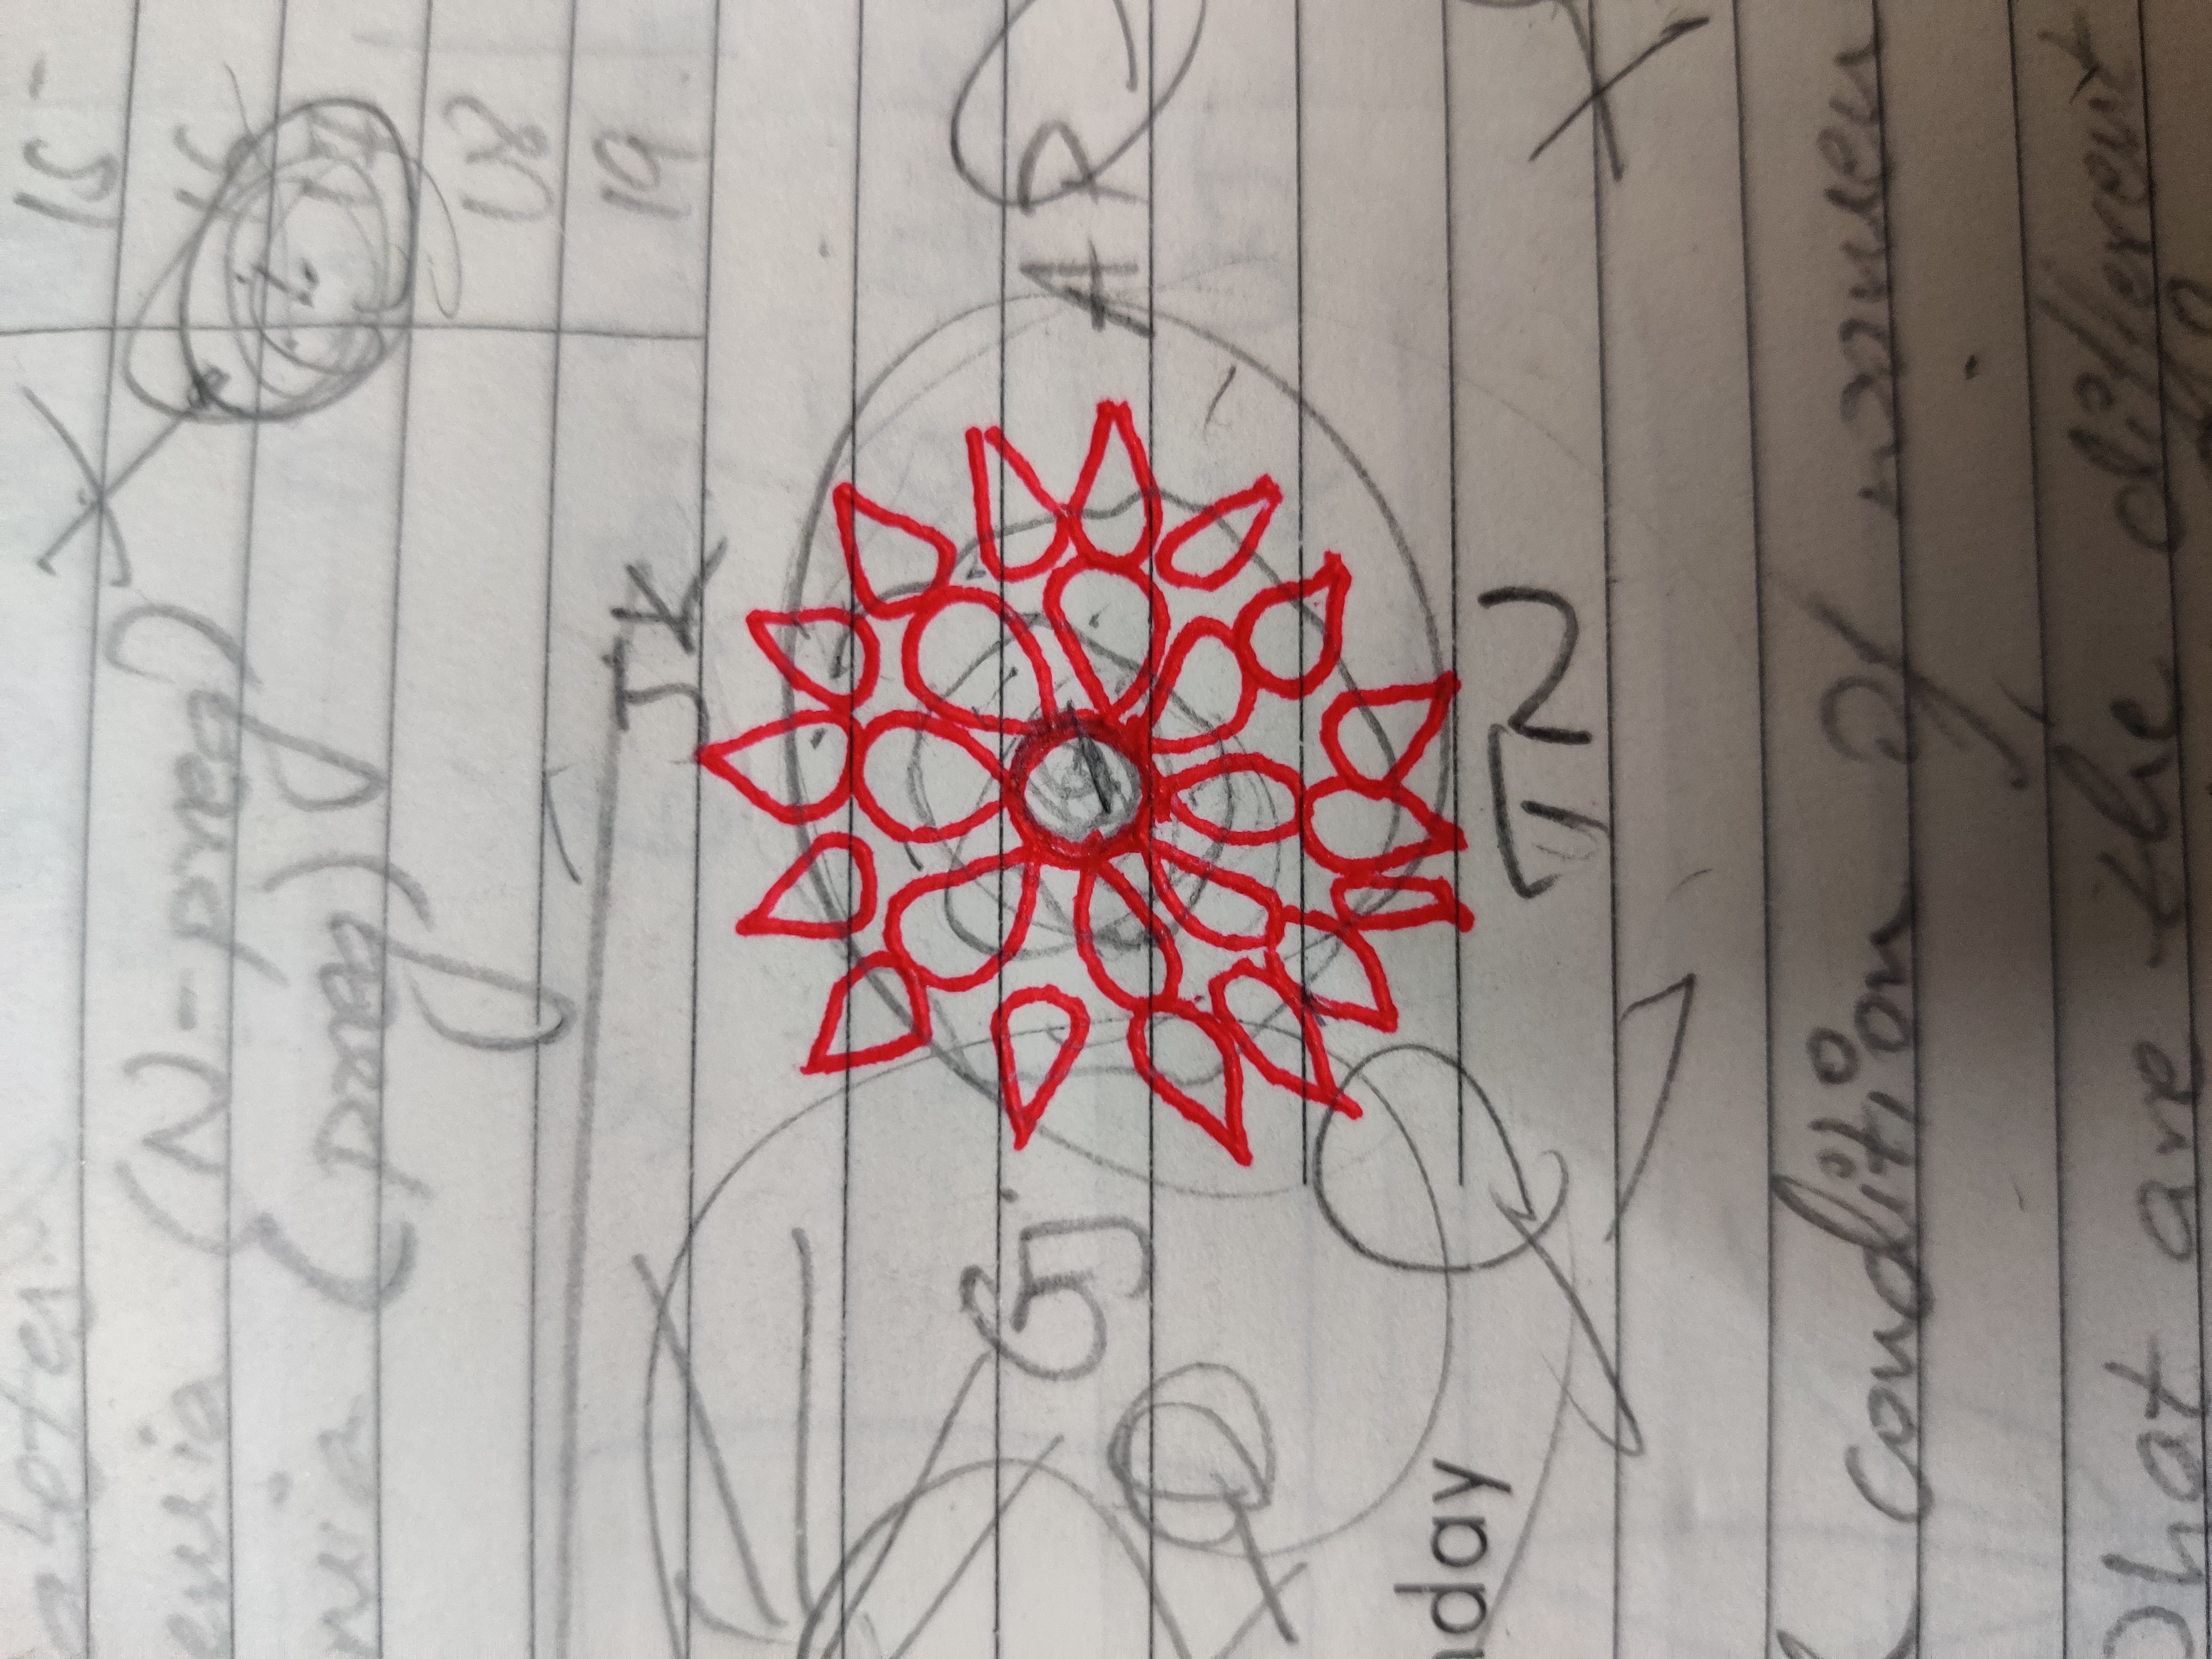
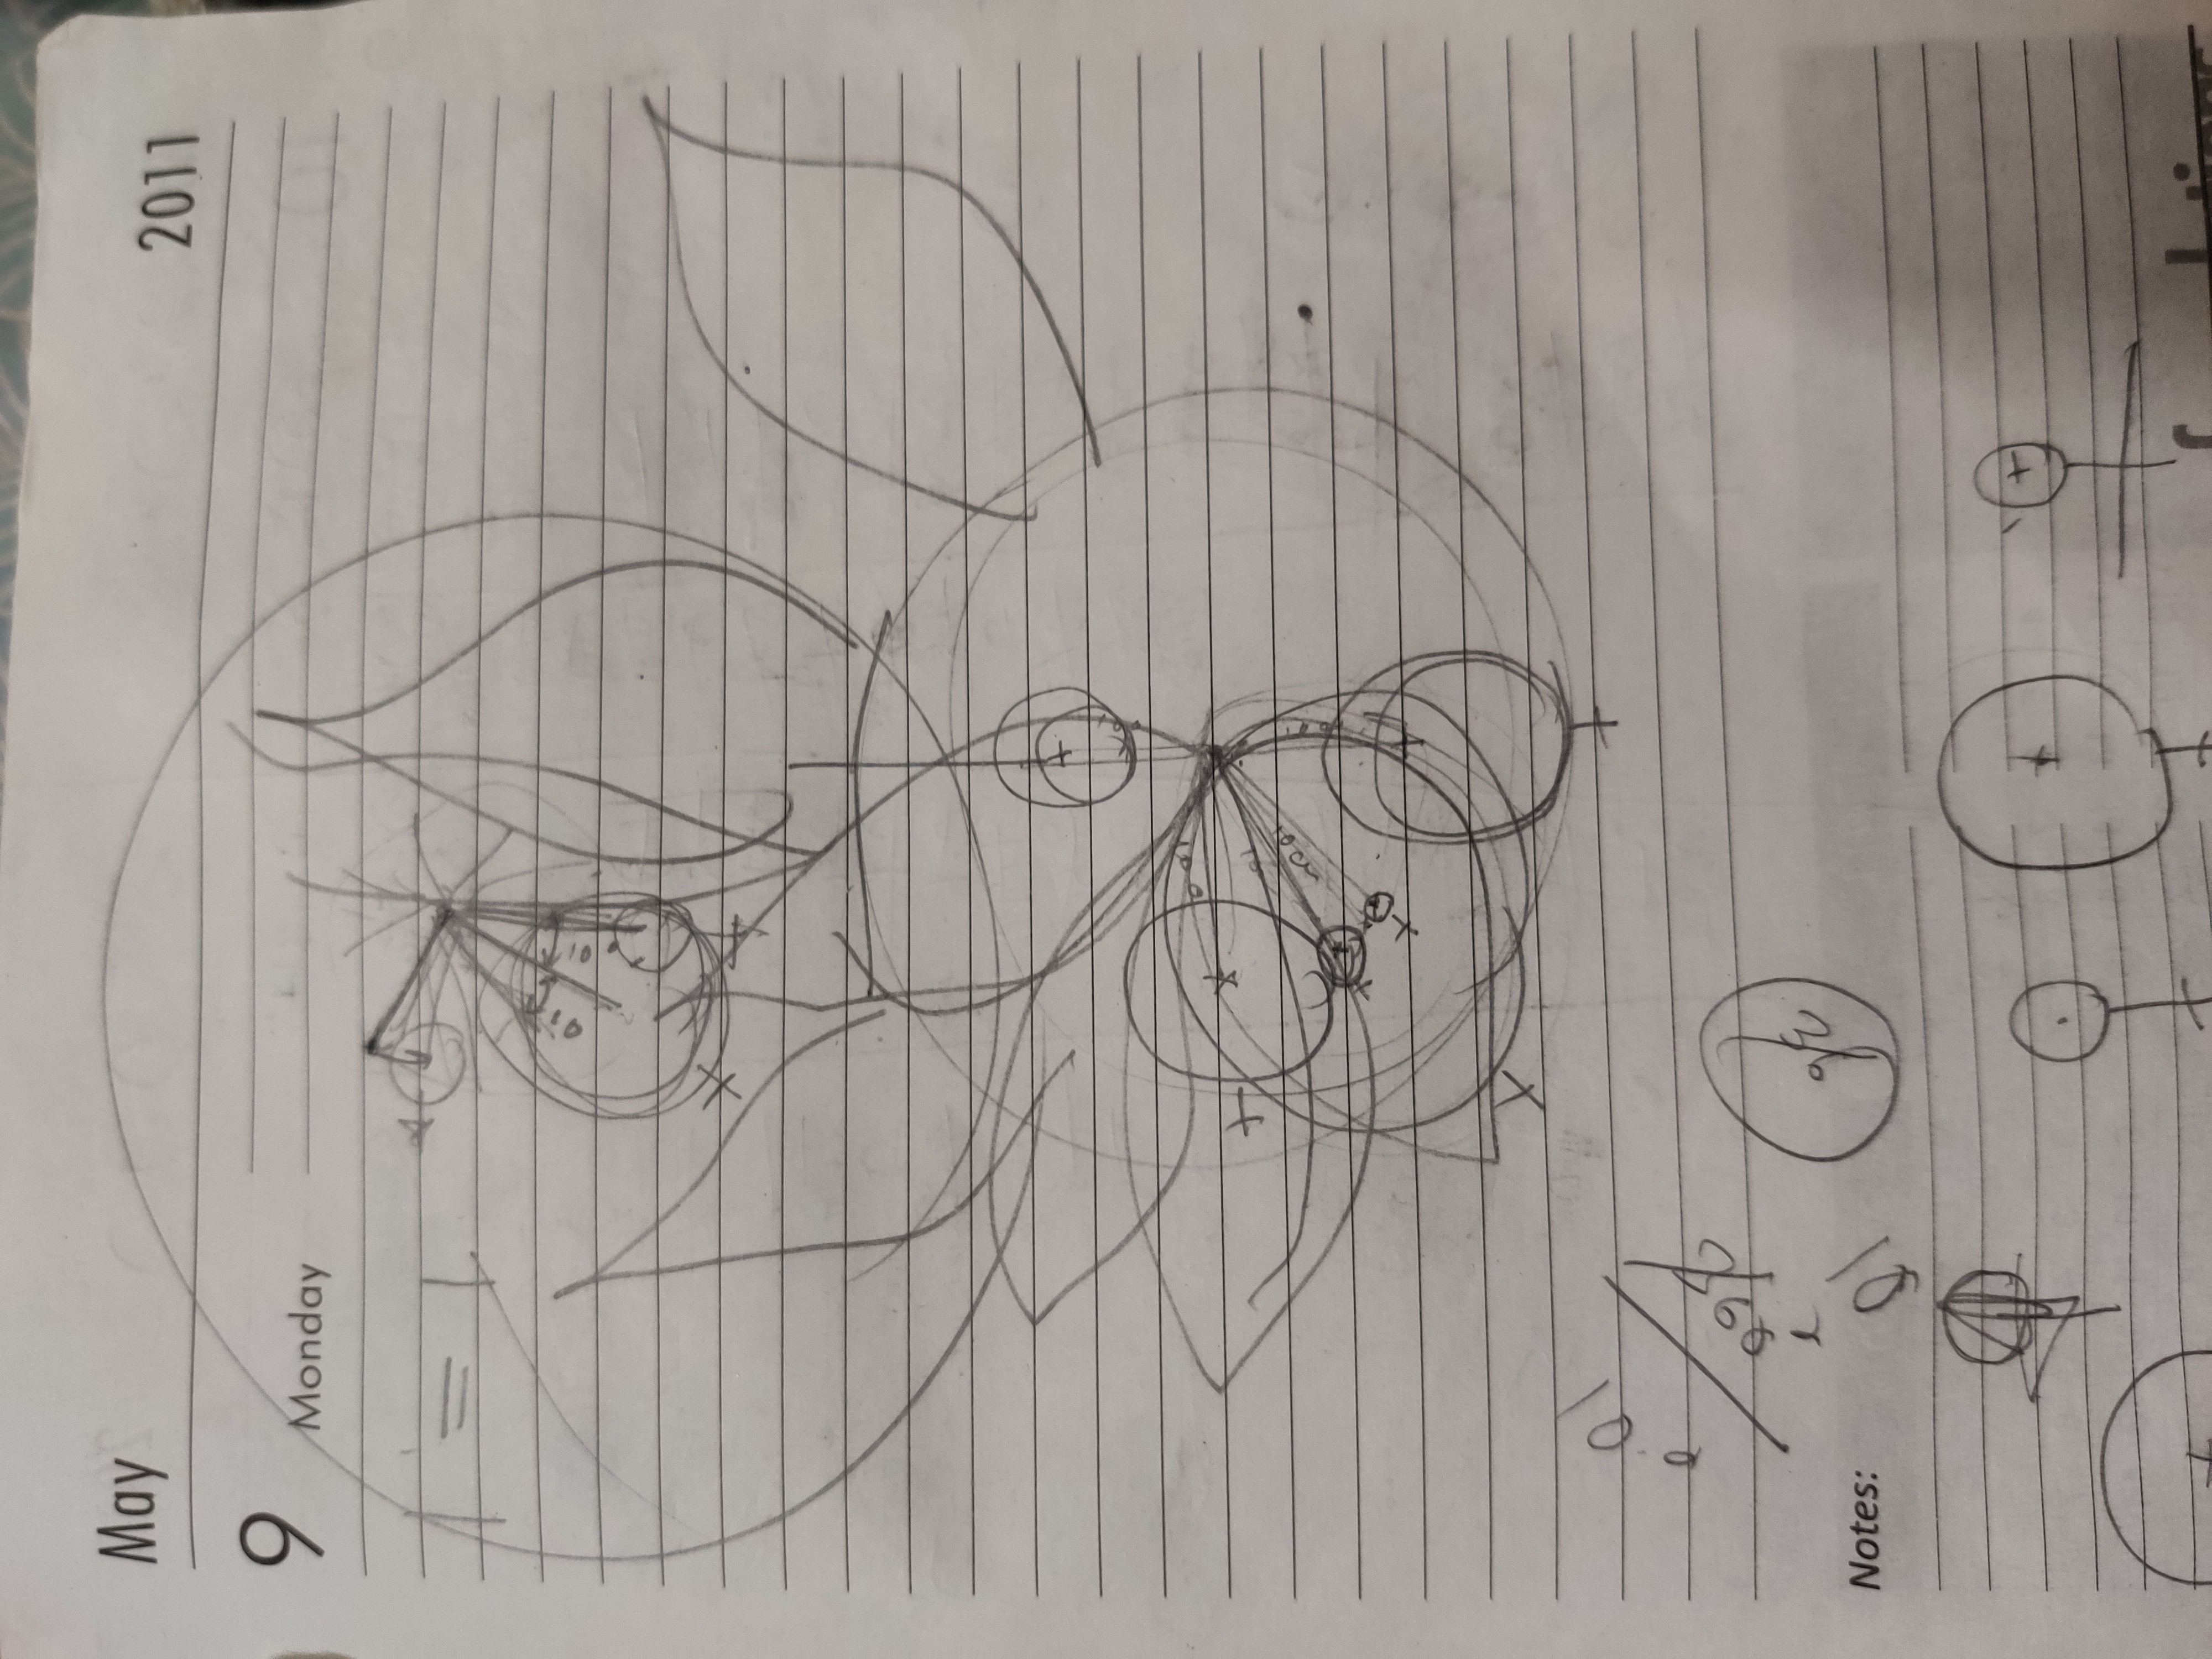
While idling one afternoon, I drew a flower-shaped doodle which sparked an idea in my head.
And something started to cook up in my head
And finally the flower turned to be a piece of abstract art.
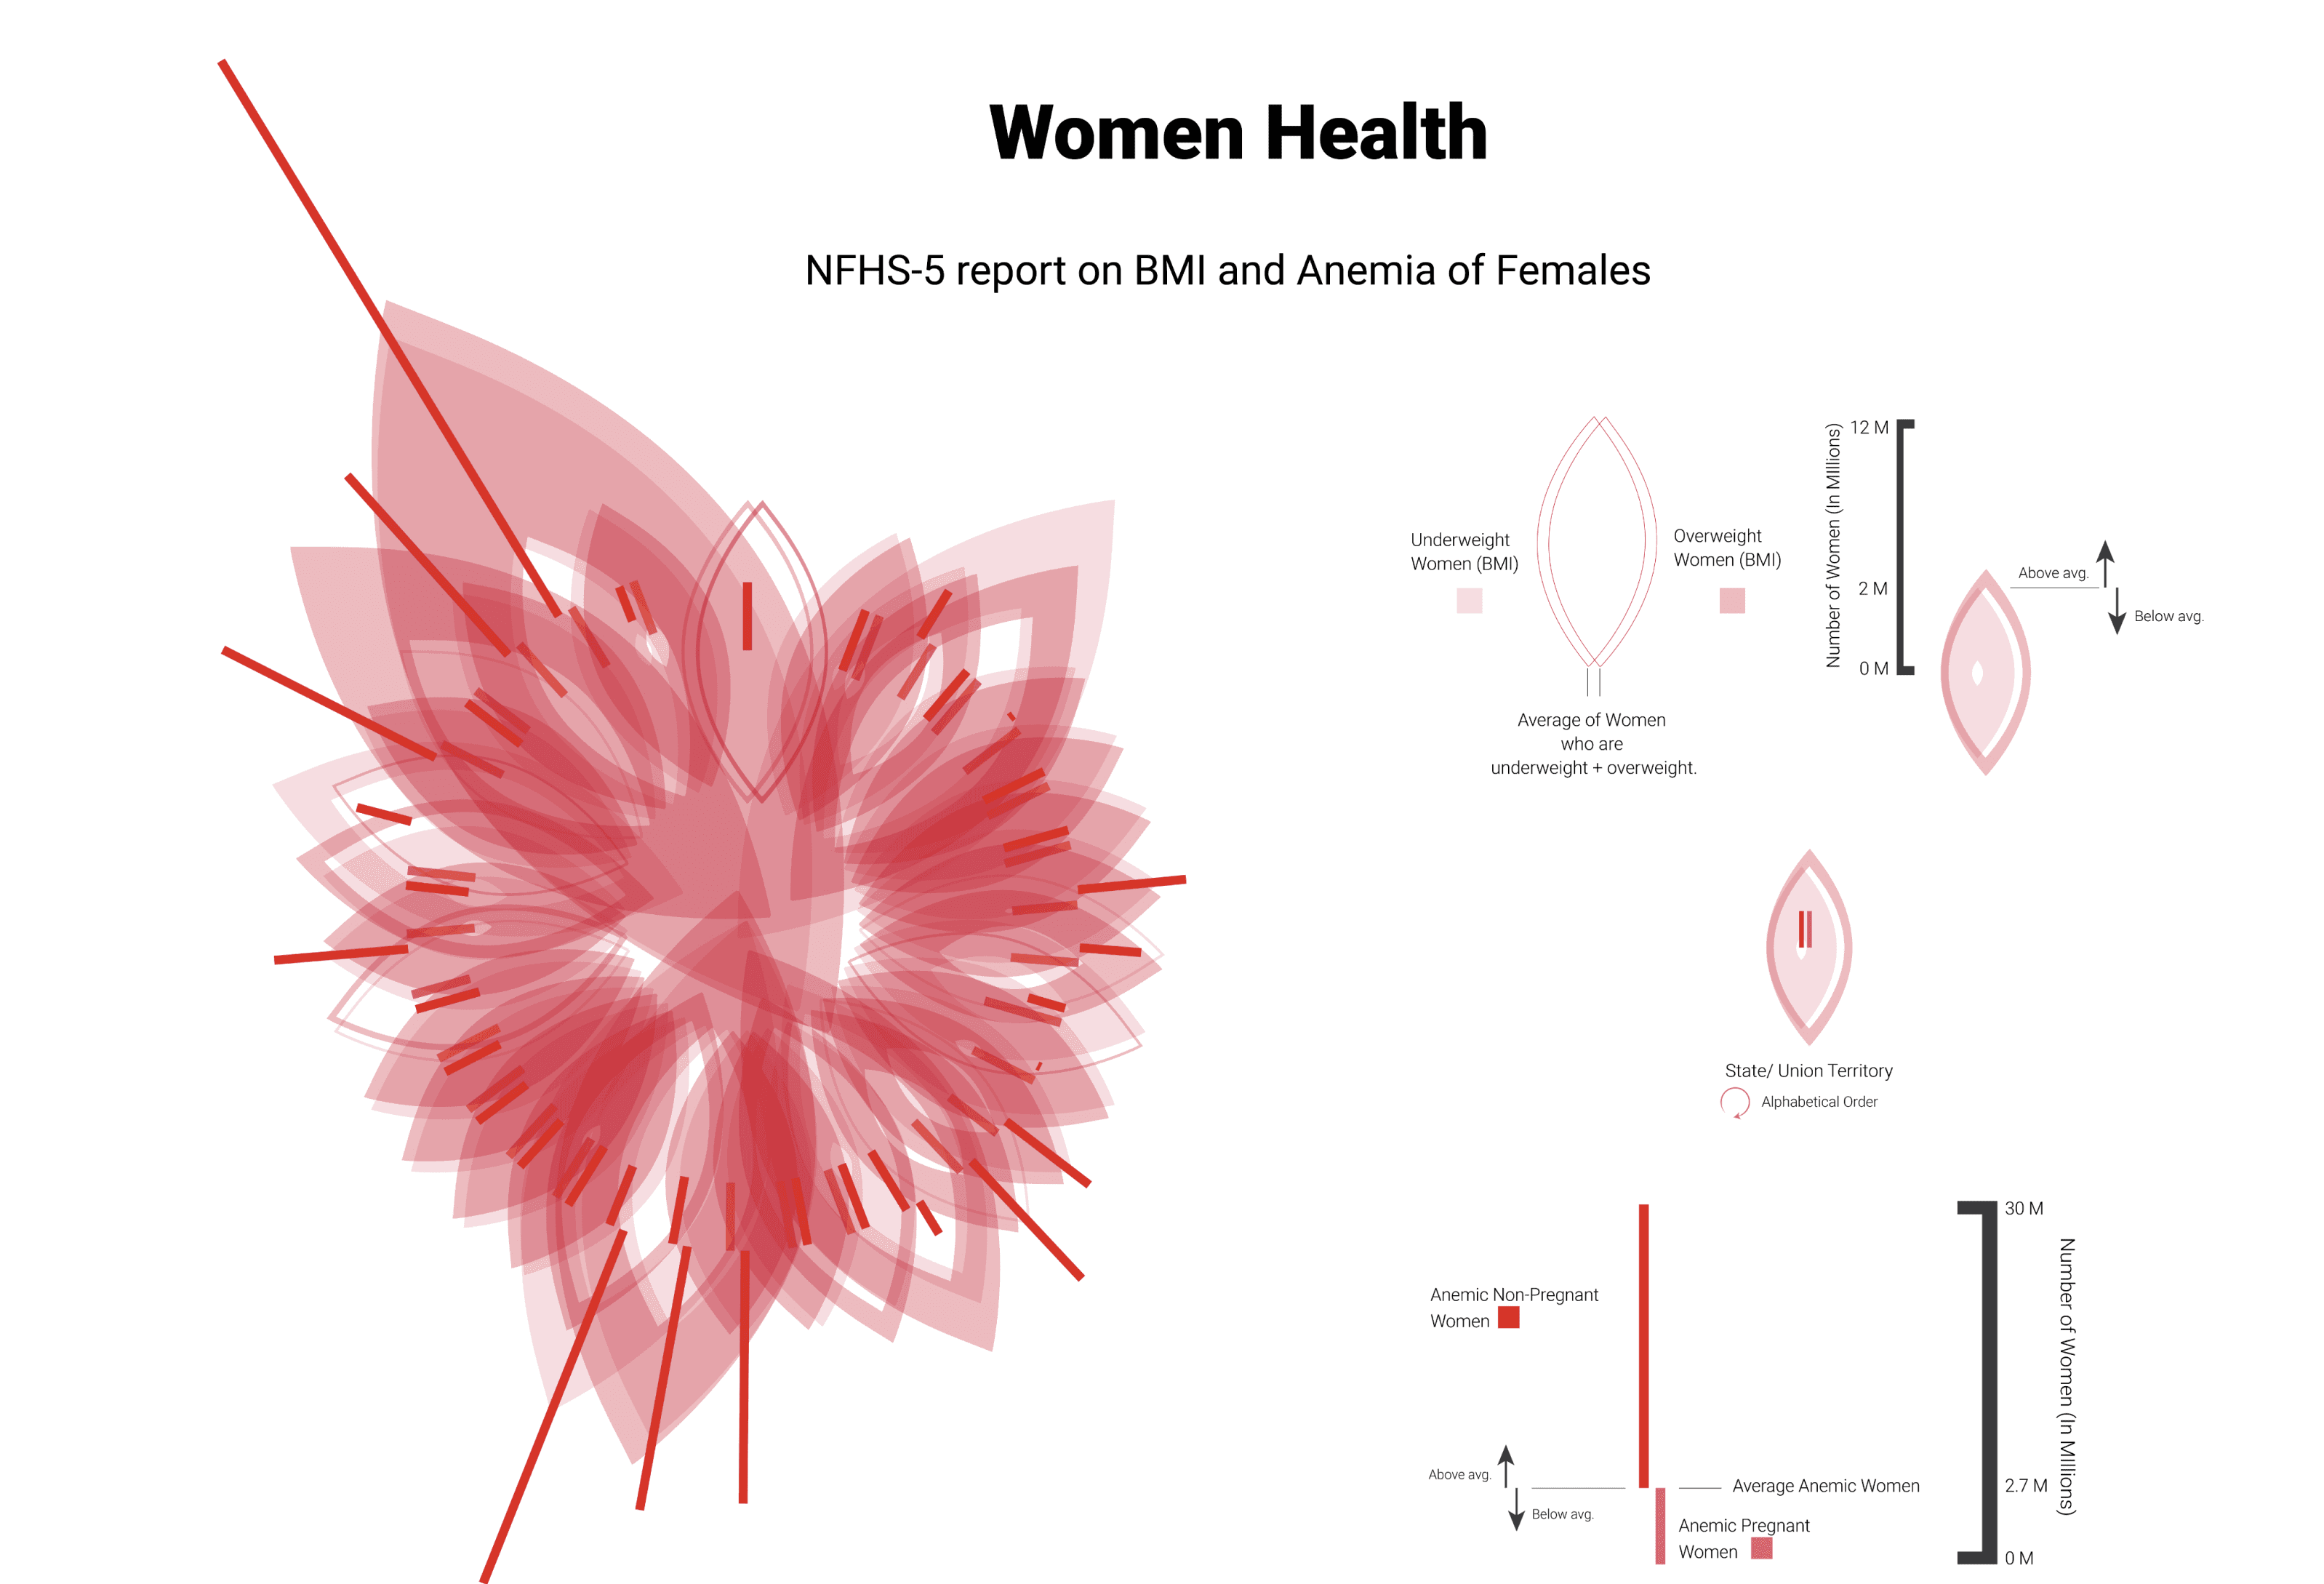
Pavitr
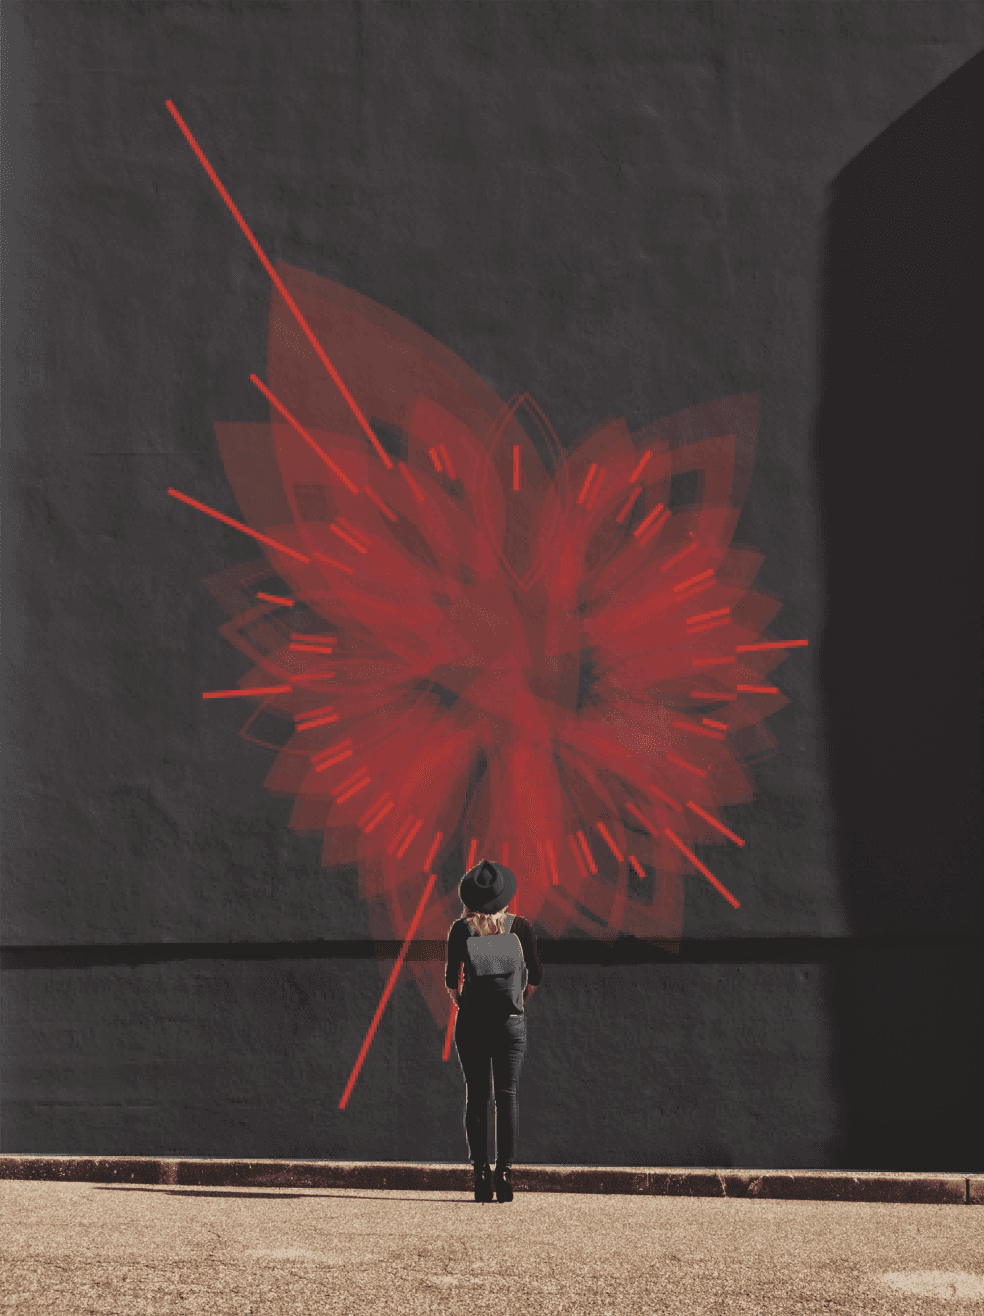
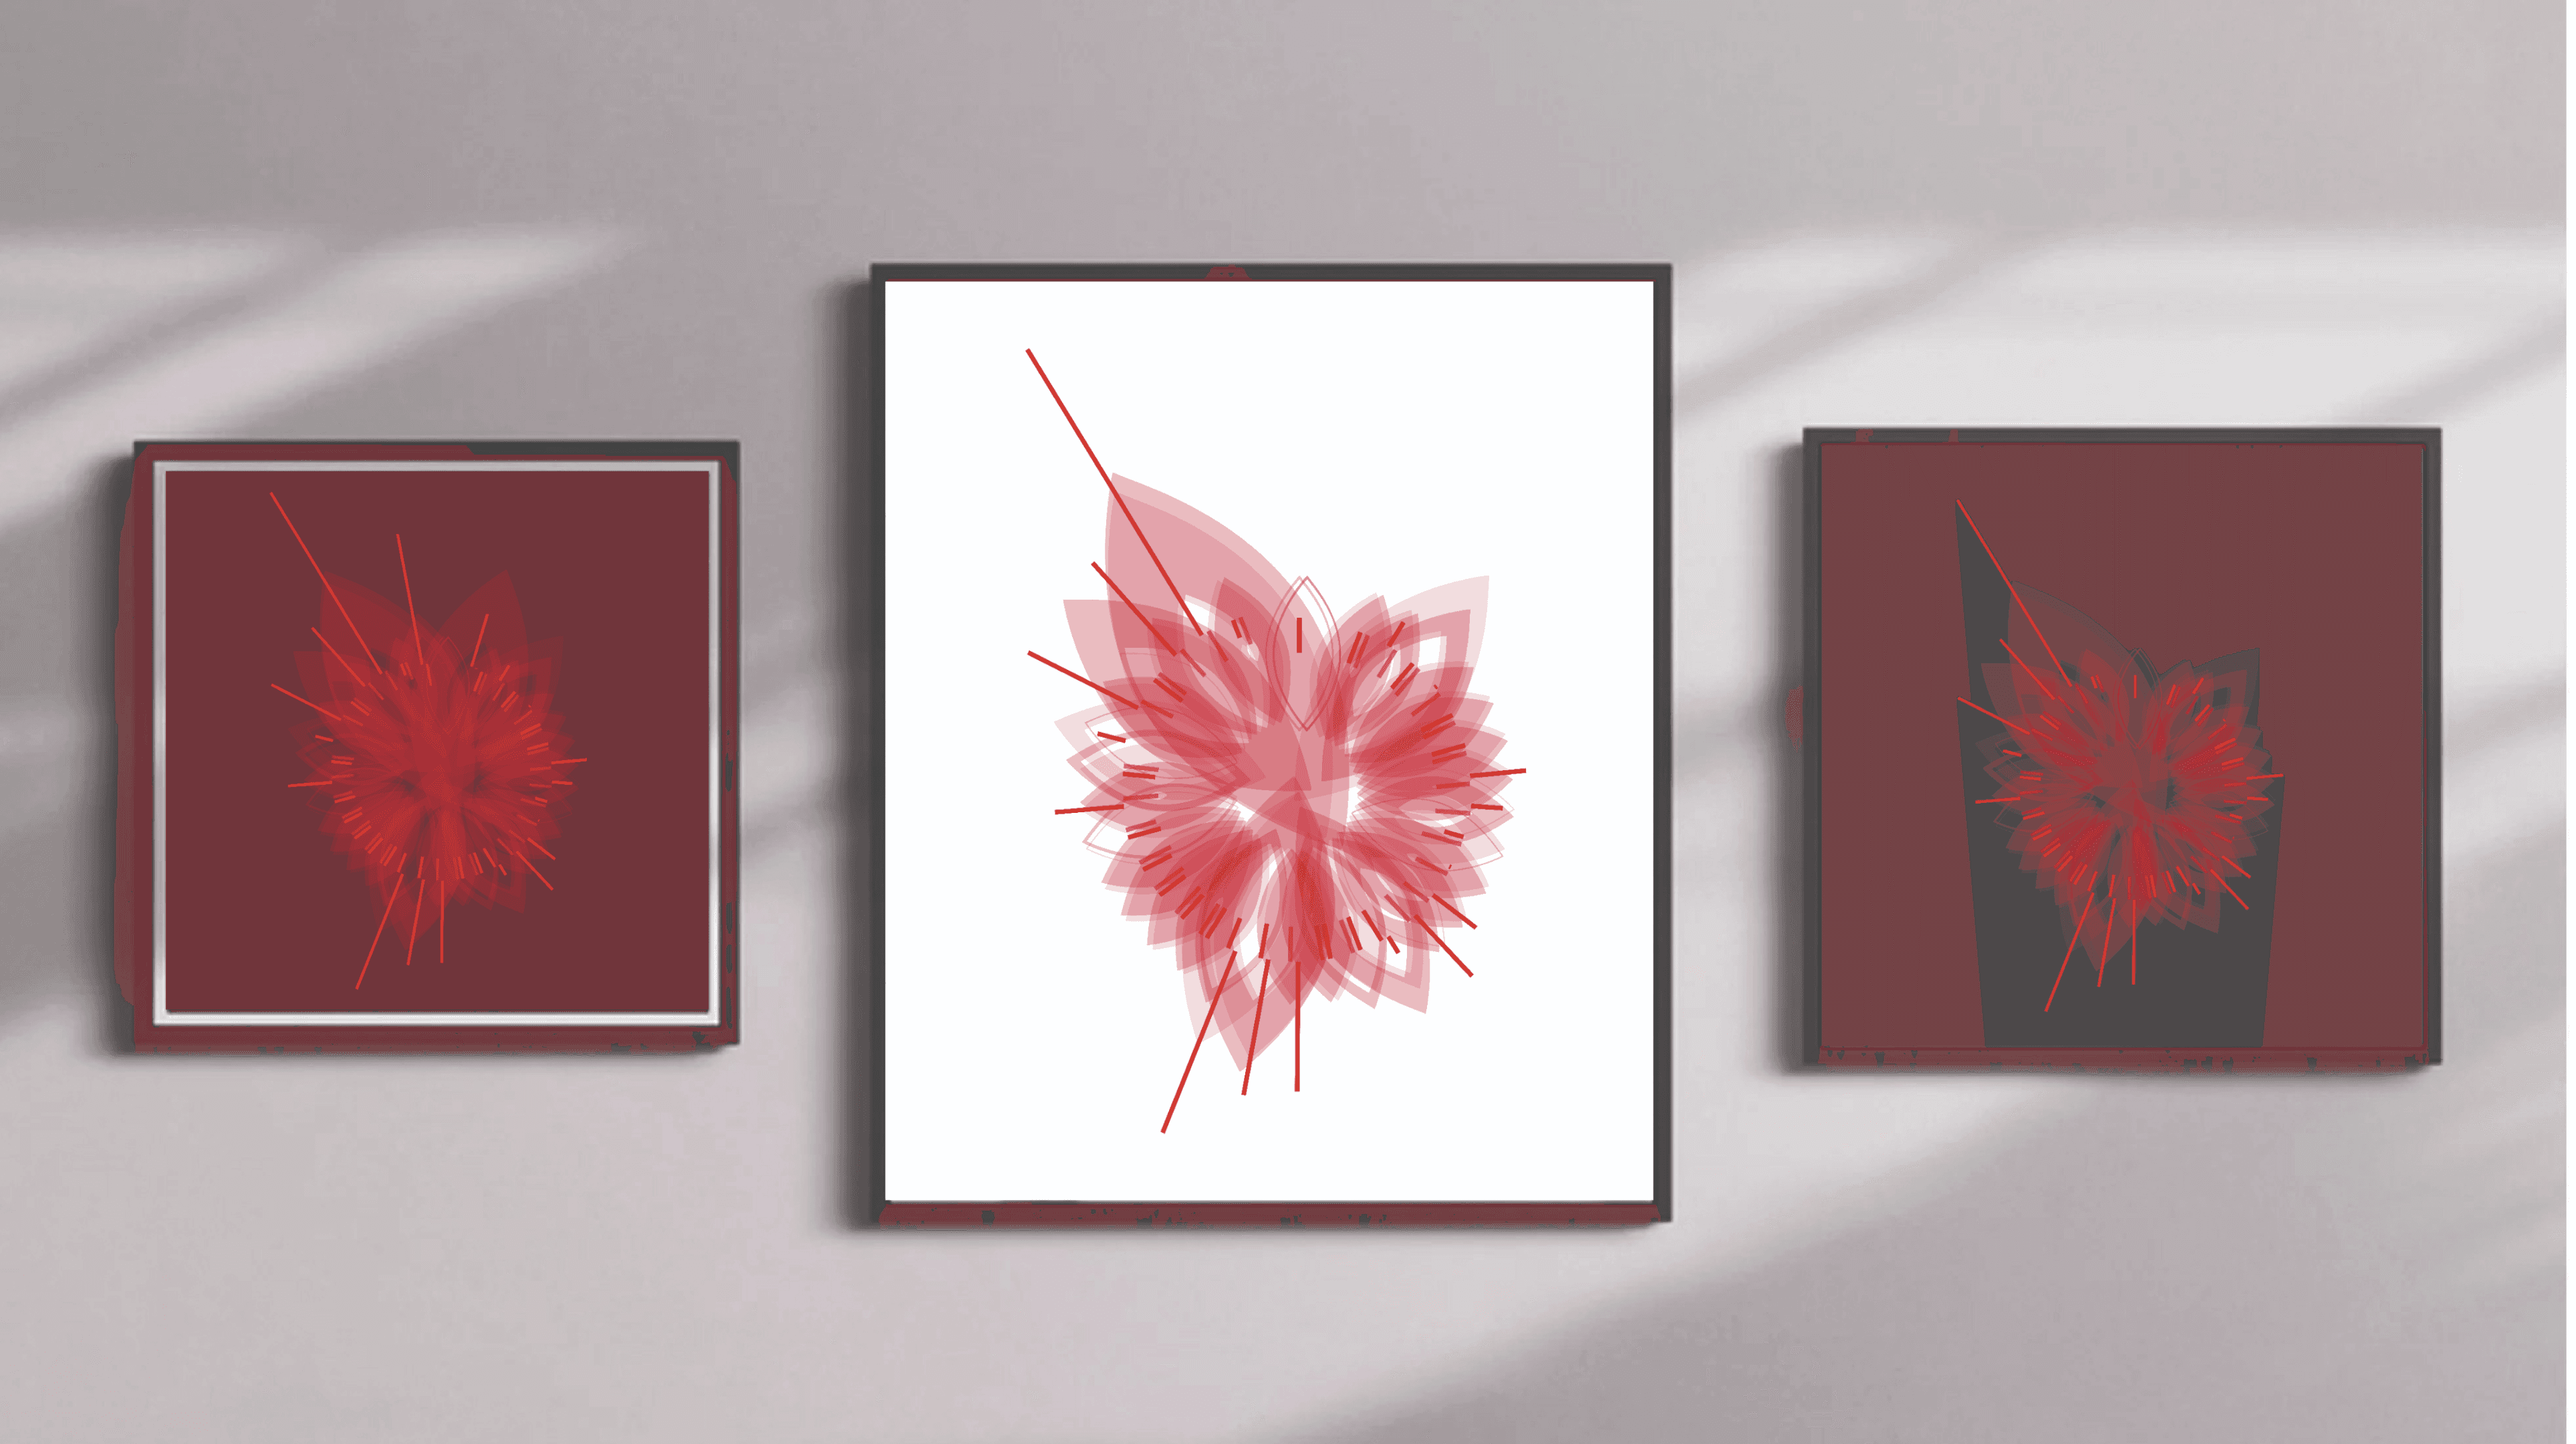
"Pavitr," a data art piece, using logic and datasets the creation of a stunning flower shape symbolizes Indian women's unity despite data variations across states.


Desktop view only!
Sorry for the inconvenience.
Have a great day!
